
Figures & data
Table 1. Phosphorus content, degree of substitution (DS) and swelling factor of native (NPS), and cross-linked potato starch (CLPS) samples prepared with different concentrations of STMP/STPP.
Figure 1. Scanning electron micrographs (left: 1000×) and light micrographs (right: 20×) of native (NPS) and cross-linked potato starches (CLPS) prepared with different STMP/STPP concentrations. (a) NPS, (b) CLPS-0.0125, (c) CLPS-0.025, (d) CLPS-0.05, (e) CLPS-0.5, (f) CLPS-5, and (g) CLPS-10.
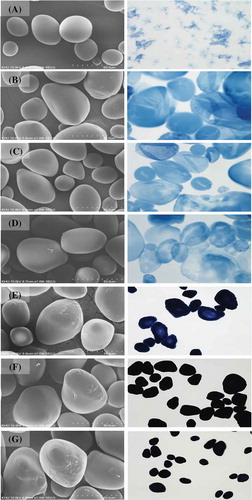
Figure 2. 31P-NMR spectra of native (a) and cross-linked potato starch (CLPS) prepared with 5% STMP/STPP concentration (b).
Table 2. Pasting properties of native (NPS) and cross-linked potato starches (CLPS) prepared with different STMP/STPP concentrations.
Figure 3. Shear stress versus shear rate plots of native (NPS) and cross-linked potato starch (CLPS) pastes prepared with different STMP/STPP concentrations at 25°C: (○) NPS, (×) CLPS-0.0125, (◇) CLPS-0.025, and (△) CLPS-0.05.
Table 3. Apparent viscosity (ηa,100), consistency index (K), flow behavior index (n), and Casson yield stress (σoc) of native (NPS), and cross-linked potato starch (CLPS) pastes prepared with different STMP/STPP concentrations at 25°C.
Figure 4. Plots of log G′, G″, η*, and tan δ versus log ω of native (NPS) and cross-linked potato starch (CLPS) pastes prepared with different STMP/STPP concentrations at 25°C: (○) NPS, (×) CLPS-0.0125, (◇) CLPS-0.025, and (△) CLPS-0.05.
Table 4. Storage modulus (G′), loss modulus (G″), complex viscosity (η*), and tan δ at 6.28 rad/s of native (NPS) and cross-linked potato starch (CLPS) pastes prepared with different STMP/STPP concentrations at 25°C.