Figures & data
Table 1. Purification of the intestinal protease of Scorpaena notata.
Figure 1. (A) Elution profile of S. not-protease after gel filtration chromatography on Toyopearl HW-50 column (0.5 mg of the protein extract was loaded to the column). (B1) Elution profile of S. not-protease on Mono Q-Sepharose anion-exchange chromatography column (0.2 mg of the protein extract was loaded to the column). Elution was carried out with a linear gradient of 0–1 mol L−1 NaCl. (B2) Zymogram detection of proteolytic activity of different fractions (F68, F69, F70, F71, F72, F73, F74) of the purified S. not-protease.
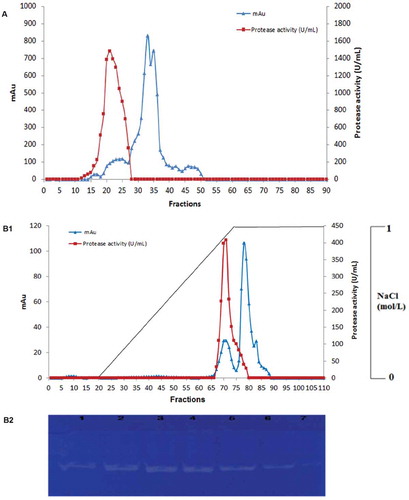
Figure 2. (A) Elution profile of S. not-protease after gel filtration chromatography on Toyopearl HW-40 column using an FPLC system (15 µg of the purified protease was loaded to the column). Elution volume of S. not-protease is showed by an arrow in the calibration curve. Protein content is shown in continuous line and activity in discontinuous line. (B) SDS–PAGE analysis of the purified S. not-protease. Lane 1, standard molecular weight markers; Lane 2, purified S. not-protease (2 µg).
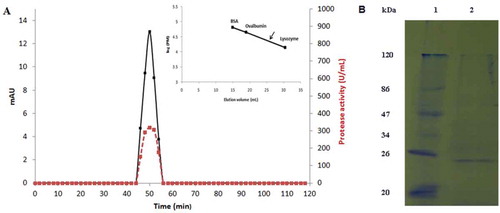
Figure 3. Effect of temperature on enzyme activity (A) and stability (B). Remaining protease activity was measured under standard assay conditions. Effect of pH on purified S. not-protease activity (C) and stability (D). The stability was estimated as residual enzyme activity after pre-incubation in different buffers for 12 h at 4°C. The results represent mean values of three independent experiments each performed in triplicates and error bars indicate standard deviation.
Table 2. Effect of various enzyme inhibitors on the activity of S. not-protease.†
Table 3. Effect of surfactants on enzyme activity of S. not-protease.†
Table 4. Effect of metal ions on enzyme activity.†
Figure 4. Effect of NaCl concentrations on activity and stability of purified S. not-protease.
Table 5. Biochemical and kinetic properties of S. not-protease and different fish proteases.
Table 6. Substrate specificity of S. not-protease toward natural substrates.
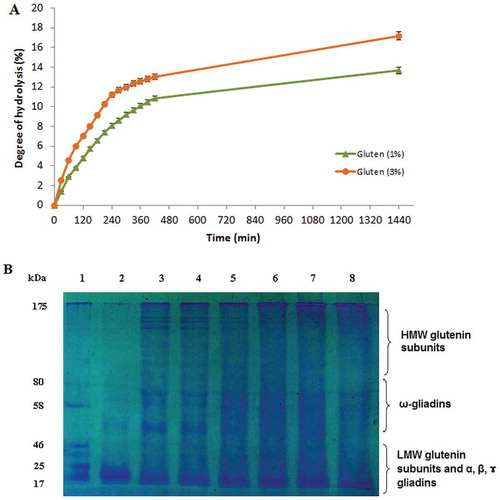
Figure 5. (A) Enzymatic hydrolysis of wheat gluten at two different concentrations (1% and 3%, w/v) with S. not-protease at an enzyme–substrate ratio of 5:1 (U mg−1). (B) SDS–PAGE analysis of gluten hydrolysate at a concentration of 3% at different reaction times. Lane 1, standard molecular weight markers; Lane 2, gluten supernatant at t = 0; Lanes 3–8, gluten hydrolysate supernatant at t = 1, 2, 4, 6, 7, and 24 h, respectively.