Figures & data
Figure 1. Block diagram of the proposed method for classification between pesticide exposed and fresh water fish.
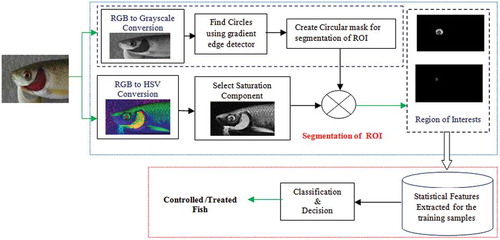
Figure 2. ROI segmentation in fish (a) Original RGB image (b) Grey scale image (c) Binary mask of ROI (d) Extracted S channel using binary mask.
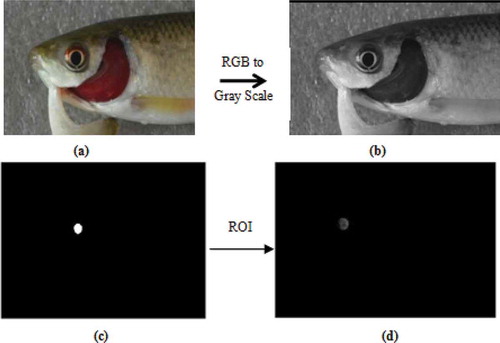
Figure 3. ROI segmentation in fish (a) Original RGB image (b) Saturation channel image (c) ROI (eye) (d) ROI (pupil of the eye).
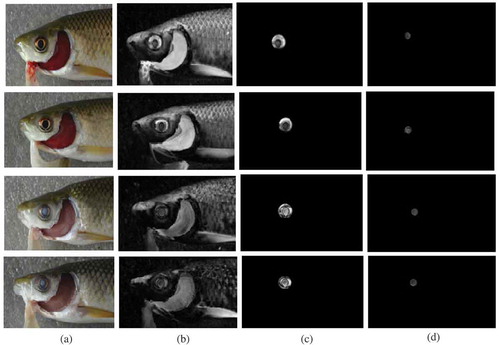
Table 1. Appearance of Eye.
Table 2. p-value of extracted features on basis of pixel intensity.
Figure 4. Box Plots a) Mean b) Standard deviation c) Variance of ROI (pupil of the eye).
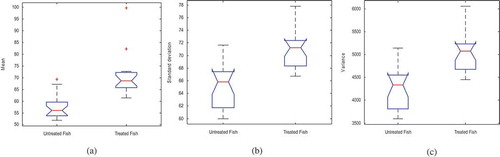
Figure 5. Box plots a) mean b) standard deviation c) variance of ROI (eye).
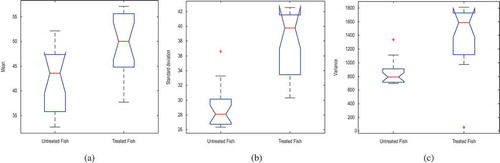
Figure 6. Classification using support vectors for classification of treated and untreated fish.
Figure 7. Bayes rule-based classification for treated and untreated fish.
Figure 8. Process of Artificial neural network used for classification of treated and untreated fish.
Figure 9. The process of random forest classifier used for machine learning.
Table 3. Statistical parameters of ROI (pupil of the eye) on basis of pixel intensity for untreated and treated fish.
Table 4. Statistical parameters of ROI (eye) on basis of pixel intensity for untreated and treated fish.
Figure 10. Variation of mean of Segmented region of untreated and pesticide treated samples.
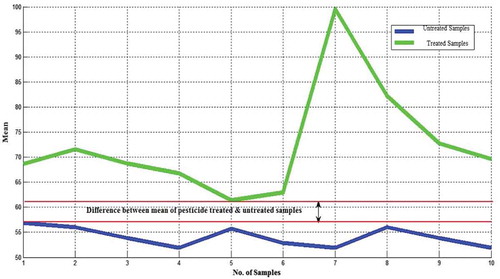
Table 5. Accuracy of classification using different classifier for pupil of the eye as ROI.
Table 6. Computation time taken by proposed method for ROI segmentation andfeature extraction (for some samples).
Figure 11. Confusion matrix for Random forest classifier.
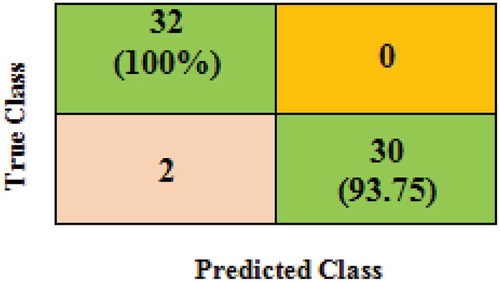
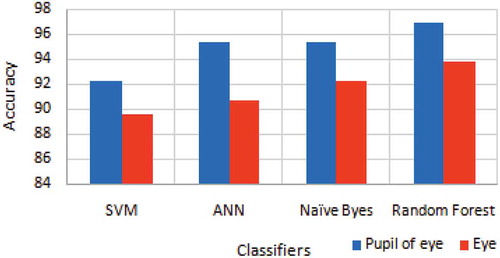
Figure 12. Comparison of accuracy of classification between both ROI.