Figures & data
Table 1. pH, moisture and fat levels of kavurma groups produced with animal fat combinations (mean ± standard deviation).
Table 2. Sensorial properties of kavurma groups produced with animal fat combinations (mean± standard deviation).
Table 3. Fatty acid composition of kavurma groups produced with animal fat combinations (mean± standard deviation) (% of total identified fatty acids).
Table 4. Volatile compounds of kavurma groups produced with animal fat combinations (mean ± standard deviation).
Figure 1. Principal component analysis biplot of the relationships between animal fat combinations and the unsaturation level of the fatty acid composition in kavurma samples (BIF: Beef intermuscular fat, BKF: Beef kidney fat, STF: Sheep tail fat).
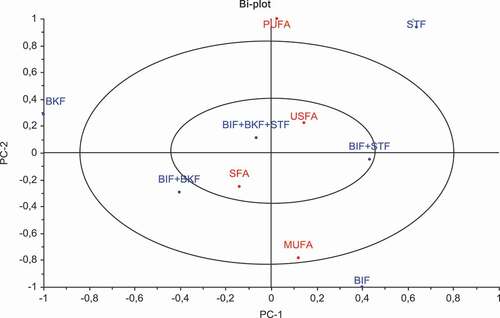
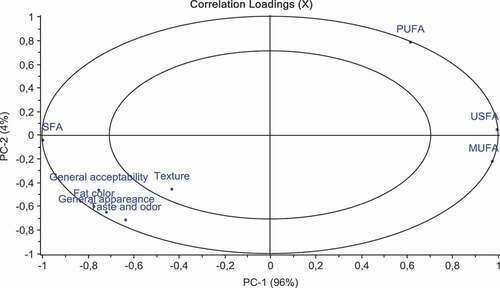
Figure 2. The relationship between sensorial properties and the unsaturation level of the fatty acid composition in kavurma samples (BIF: Beef intermuscular fat, BKF: Beef kidney fat, STF: Sheep tail fat).