Figures & data
Figure 1. The flow chart for aqueous enzymatic extraction of rapeseed oil.
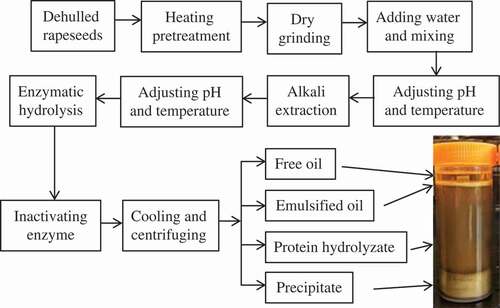
Table 1. Optimal enzymatic hydrolysis conditions of proteases.
Figure 2. Effects of proteases on free oil and total oil yield.
Figure 3. Protein hydrolysis and oil release state under different enzymatic hydrolysis time (a control; b 1.0 h; c 2.0 h; d 2.5 h; e 3.0 h; f 4.0 h).
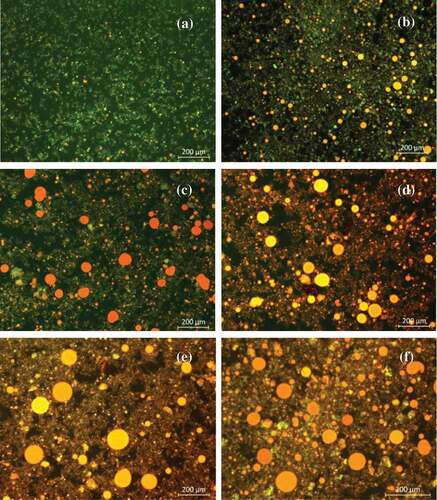
Figure 4. Effects of hydrolysis time on protein degree of hydrolysis and free oil yield.
Table 2. The secondary structure content (%) of proteins in different hydrolysis time.
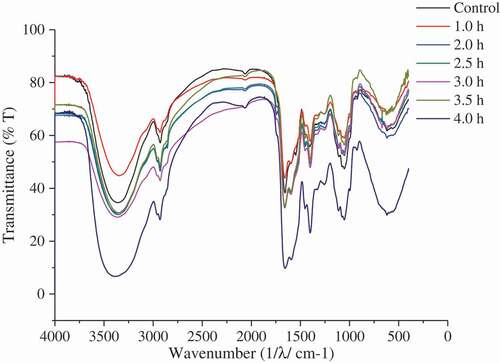
Figure 5. FTIR spectra of proteins in different hydrolysis time.