Figures & data
Table 1. List of species with collection details.
Table 2. The transitions and optimized compound-dependent MRM parameters: declustering potential (DP), entrance potential (EP), collision energy (CE), and cell exit potential (CXP) of 19 analytes.
Figure 1A. Structures and MS/MS spectra of standard compounds.

Figure 1B. Structures and MS/MS spectra of standard compounds.
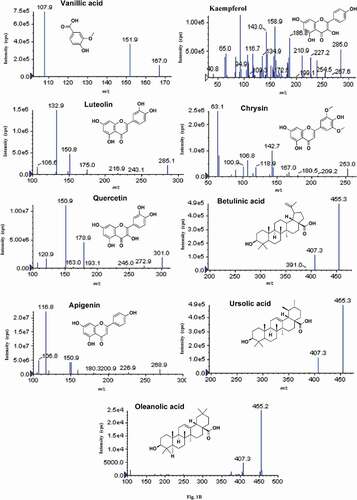
Figure 2A. Extracted ion chromatogram of 19 analytes.
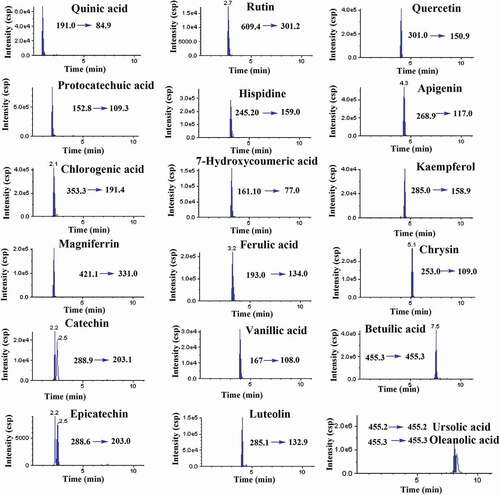
Figure 2B. Extracted ion chromatogram of 19 analytes.
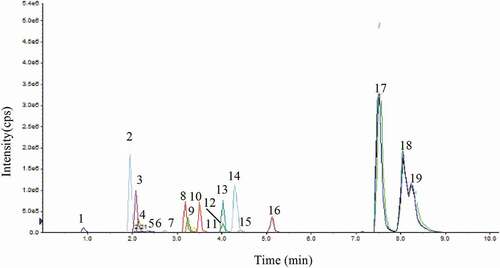
Table 3. Linear regression, correlation coefficient (R2), limit of detection (LOD), limit of quantitation (LOQ), intra-day and inter-day precision, and recovery of compounds 1–19 in terms of peak area.
Table 4. The content of 19 compounds (mg/g) in ethanolic extracts of the fruits, leaves, and barks of F. religiosa, F. benghalensis, F. palmata subsp. virgata, F. virens, F. lyrata, F. benjamina, F. hispida, and F. racemosa.
Figure 3. Graphical presentation of the total contents of 19 compounds in fruits, leaves, and barks in eight Ficus species.
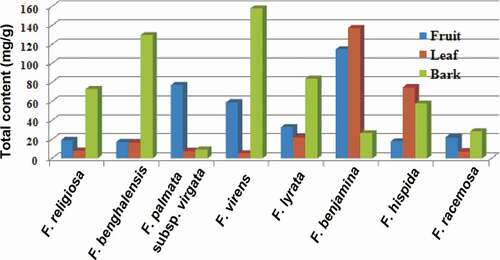
Figure 4. PC1 vs. PC2 plot showing discrimination among eight Ficus species in fruits (A), leaves (B), and barks (C) on the basis of the contents of 15 bioactive compounds (protocatechuic acid, chlorogenic acid, mangiferin, catechin, epicatechin, rutin, hispidine, 7-hydroxycoumaric acid, ferulic acid, vanillic acid, luteolin, quercetin, apigenin, kaempferol, chrysin, betulinic acid, ursolic acid, and oleanolic acid).
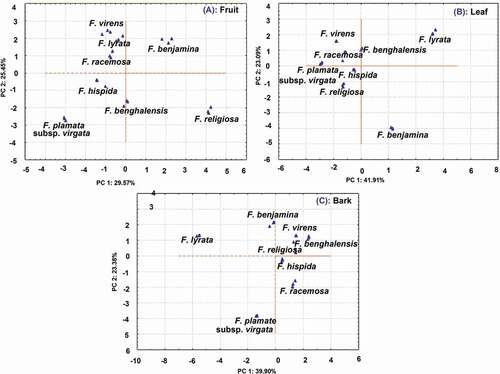
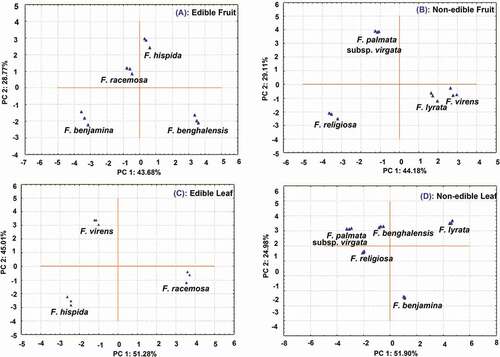
Figure 5. PC1 vs. PC2 plot showing discrimination between edible and non-edible fruits and leaves on the basis of 15 bioactive compounds (quinic acid, protocatechuic acid, chlorogenic acid, mangiferin, catechin, epicatechin, rutin, hispidine, 7-hydroxycoumaric acid, ferulic acid, vanillic acid, luteolin, quercetin, apigenin, kaempferol, chrysin, betulinic acid, ursolic acid, and oleanolic acid).