Figures & data
Figure 1. Total phenolics extraction optimization, effects of extraction solvent (a), sonication time (b), liquid-to-solid ratio, (c) and sonication temperature (d). Different letter in graph means significant difference (ANOVA, p < 0.05).
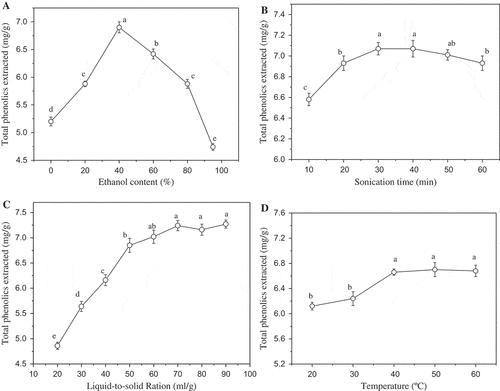
Table 1. Characterization of phenolic components in G. bicolor extract by HPLC-Q-TOF-MS.
Table 2. The EC50 values of G. bicolor extract and vitamin C with different antioxidant tests (μg/mL).
Figure 2. Base peak chromatogram (a) and absorbance chromatogram recorded at 327 nm (b) of G. bicolor total phenolic extract.
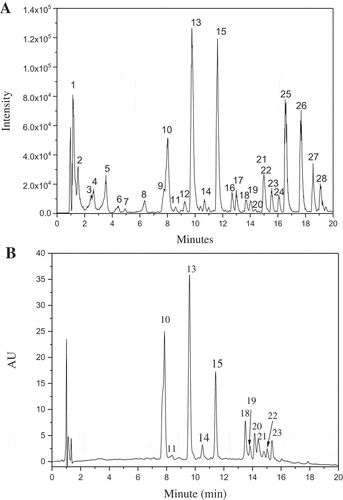
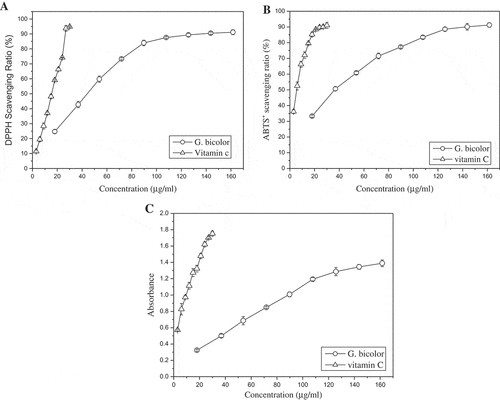
Figure 3. Antioxidant activity of G. bicolor total phenolic extract. (a) DPPH radical-scavenging assay; (b) ABTS radical-scavenging assay; (c) reducing power assay.