Figures & data
Table 1. Rheological parameters of the emulsions that were obtained from the hydrocolloids that were vacuum oven-dried and freeze-dried at different concentrations.
Figure 1. Shear stress as a function of shear rate and curves adjusted by power law for emulsions prepared with OPN hydrocolloids (0.5, 1.0, 1.5, 2.0, 2.5, and 3.0 g OPN/100 g aqueous phase) that were (a) vacuum oven-dried and (b) freeze-dried.
Table 2. Thixotropy mean values for the emulsions that were obtained from the OPN hydrocolloids that were vacuum oven-dried and freeze-dried at different concentrations.
Figure 2. Thixotropic behavior of emulsions prepared with different OPN hydrocolloid concentrations (0.5, 1.0, 1.5, 2.0, 2.5, and 3.0 g OPN/100 g aqueous phase) and drying methods (a) vacuum oven (VO)-dried and (b) freeze-dried (FD).
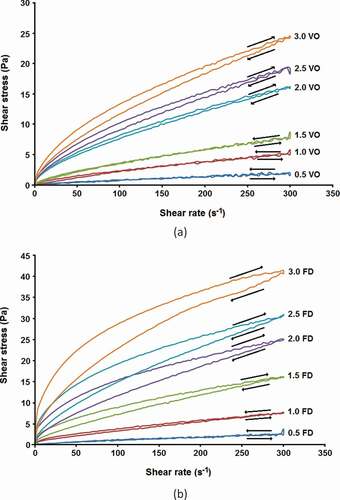
Figure 3. (1) Elastic modulus (G’),viscous modulus (G”), and (2) tan δ as function of frequency for emulsions prepared with different concentrations of OPN hydrocolloids (1.0, 2.0, and 3.0 g OPN/100 g aqueous phase) obtained from different drying methods: (a) Vacuum oven and (b) freeze-drying.
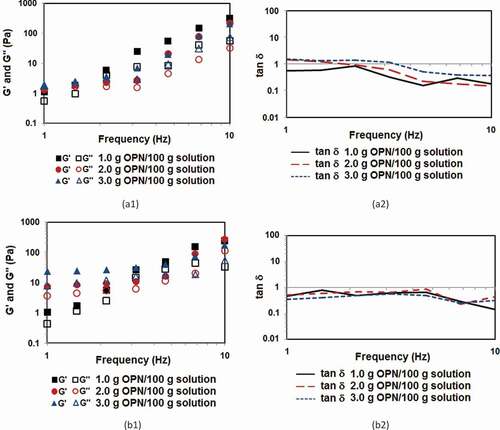
Table 3. Parameters of exponential model adjusts applied in the droplet size analyses.
Figure 4. Micrographs of the FD emulsions at concentrations of (a) 0.5 g OPN/100 g aqueous phase; (b) 2.5 g OPN/100 g aqueous phase.
Figure 5. (a) Results of droplet size analyses of freeze-dried OPN hydrocolloids; (b) Results for secondary parameters, compactness, and shape factor.
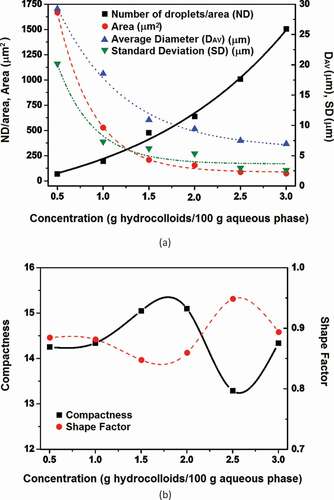
Figure 6. Droplet size distributions for emulsions prepared with freeze-dried OPN hydrocolloids at concentrations of (a) 0.5; (b) 1.0; (c) 1.5; (d) 2.0; (e) 2.5; and (f) 3.0 g OPN/100 g aqueous phase.
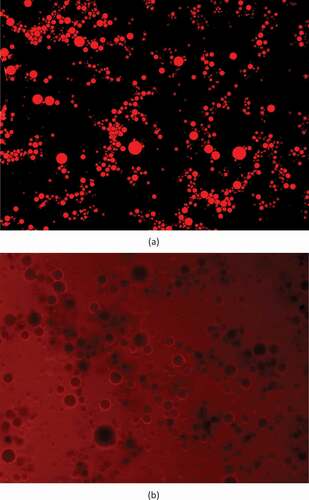
Figure 7. Fluorescence photomicrograph of emulsions constituted of 2.0 g of OPN gum/100 g of aqueous phase stained with (a) Red Nile (fluorescence of lipids) and (b) Rhodamine B (fluorescence of proteins) dyes.