Figures & data
Figure 1. SDS-PAGE profile for soybean 7S globulin treated with ultrasound following the deglycosylation. Lane 1: Native; Lane 2: Deglycosylation; Lane 3: Ultrasound 80 min assisted deglycosylation; Lane 4: Ultrasound 100 min assisted deglycosylation. (A) Coomassie Brilliant blue staining and (B) Schiff reagent staining.
Figure 2. RP-HPLC analysis of soybean 7S globulin treated with ultrasound following the deglycosylation. 1: Native; 2: Deglycosylation; 3: Ultrasound 80 min assisted deglycosylation; 4: Ultrasound 100 min assisted deglycosylation.
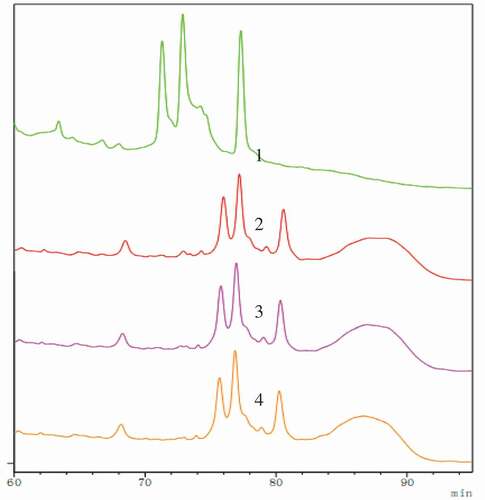
Figure 3. Far-UV CD spectrum analysis of soybean 7S globulin treated with ultrasound following the deglycosylation.
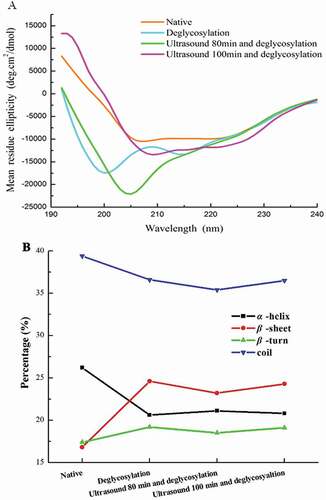
Figure 4. UV spectrum analysis (A) and surface hydrophobicity (B) of soybean 7S globulin treated with ultrasound following the deglycosylation.
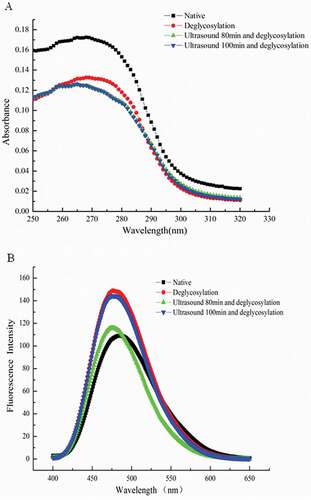
Figure 5. Field emission scanning electron microscope analysis of soybean 7S protein treated with ultrasonic and deglycosylation. A: Native; B: Deglycosylation; C: Ultrasound 80 min assisted deglycosylation; D: Ultrasound 100 min assisted deglycosylation; E: PNGase F.
Figure 6. IgE-binding of soybean 7S globulin treated with ultrasound following the deglycosylation. Each data value is expressed as mean ± SD (n = 3). *p < 0.05, ***p < 0.001 indicates significant difference as compared to that of the control.