6,204
Views
17
CrossRef citations to date
0
Altmetric
Articles

Quantification of coumarin and related phenolics in cinnamon samples from south India using UHPLC-ESI-QqQLIT-MS/MS method

, , & ORCID Icon
Pages 50-57 | Received 03 Aug 2017, Accepted 03 Feb 2018, Published online: 18 Apr 2018

Figures & data

Figure 1. Structures of standard analytes (1–5).

Figure 1. Structures of standard analytes (1–5).

Table 1. Cinnamon samples, source, sample code and herbarium number.

Figure 2. TICs of (a). Standard analytes positive and negative combined mode (1-coumarin, 2-scopoletin, 3-E-o-coumaric acid, 4-cinnamic acid and 5-cinnamaldehyde) (b). Cinnamon market sample M-1 and (c). Cinnamon authentic sample M-6.

Figure 2. TICs of (a). Standard analytes positive and negative combined mode (1-coumarin, 2-scopoletin, 3-E-o-coumaric acid, 4-cinnamic acid and 5-cinnamaldehyde) (b). Cinnamon market sample M-1 and (c). Cinnamon authentic sample M-6.

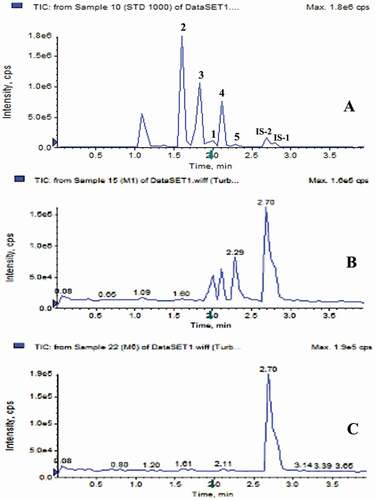
Table 2. Content (mg/kg dry weight) of analytes in C. verum bark samples (mean ± SD, n = 3).

Figure 3. Coumarin content (mg/kg) in cinnamon samples (M-1 to M-10).

Figure 3. Coumarin content (mg/kg) in cinnamon samples (M-1 to M-10).
Supplemental material

Supplemental Material

Download ()