Figures & data
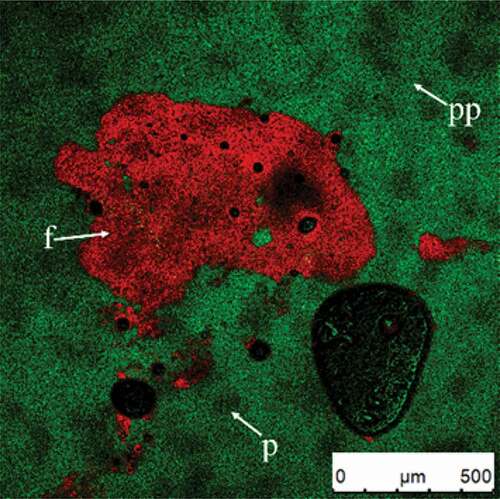
Figure 1. CSLM-micrographs of original cream (A) and diluted cream (five times using distilled water) (B). Red and green signals in plasma phase (pp) represent fat (f) and protein (p), respectively.
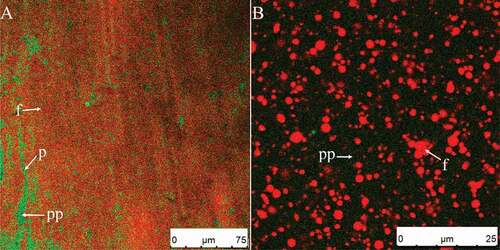
Figure 2. The overrun of the whipped cream at different whipping time.
Figure 3. CSLM-micrographs of cream whipped for 15 s at low speed (950 rpm) (A). Image shown in Fig. 3C was taken 80 s later than Fig. 3B of the same air bubble. Red and green signals in plasma phase (pp) represent fat (f) and protein (p), respectively. Black circled areas are air bubble centers (ac); green circles are protein membranes on air bubble surfaces (pm).
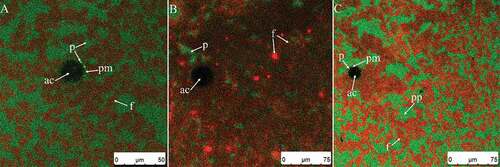
Figure 4. The particle size distribution of various whipped cream produced with a series of whipping durations.
Figure 5. (A–E) CSLM-micrographs of cream whipped for 30 s at low speed (950 rpm). Red and green signals in plasma phase (pp) represent fat (f) and protein (p), respectively. Black or green circled areas are the center (ac) or surface (as) of air bubbles, respectively; green circles and area signals indicate protein membranes (pm).
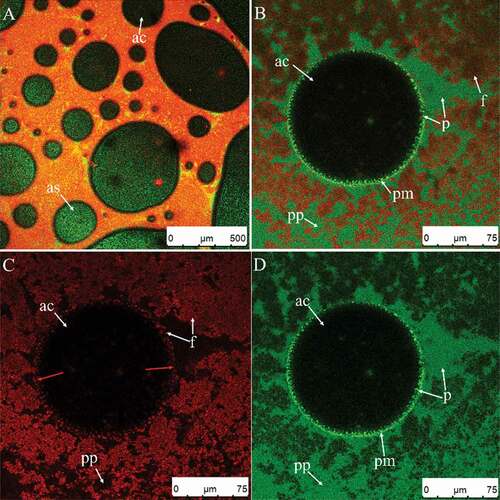
Figure 6. CSLM-micrographs of cream whipped for 30 s at low speed (950 rpm) then for 30 s at high speed (1100 rpm) (A–F). Red and green signals in plasma phase (pp) represent fat (f) and protein (p), respectively. Black or green circled areas are the center (ac) or surface (as) of air bubbles, respectively; green circles and area signals indicate protein membranes (pm).
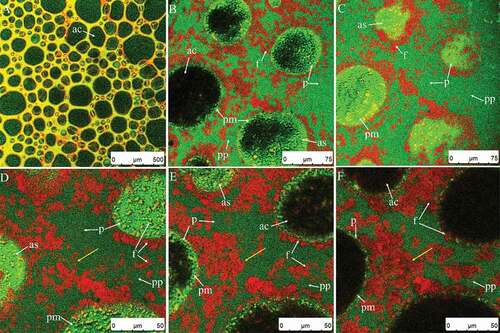
Figure 7. The firmness of the whipped cream at different whipping time.
Figure 8. CSLM-micrographs of cream whipped for 30 s at low speed (950 rpm) then for 60 s at high speed (1100 rpm) (A–E). Red and green signals in plasma phase (pp) represent fat (f) and protein (p), respectively. Black or green circled areas are the center (ac) or surface (as) of air bubbles, respectively; green circles and area signals indicate protein membranes (pm).
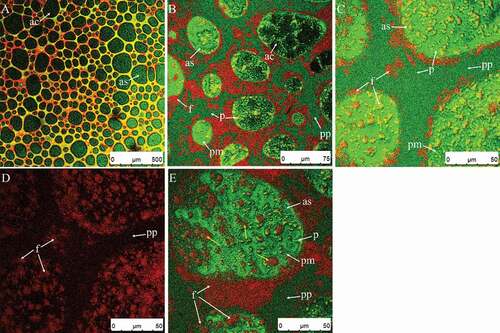
Figure 9. CSLM-micrographs of cream whipped for 30 s at low speed (950 rpm) then for 90 s (A) or 100 s (B–D) at high speed (1100 rpm). Red and green signals in plasma phase (pp) represent fat (f) and protein (p), respectively. Black or green circled areas are the center (ac) or surface (as) of air bubbles, respectively; green circles and area signals indicate protein membranes (pm).
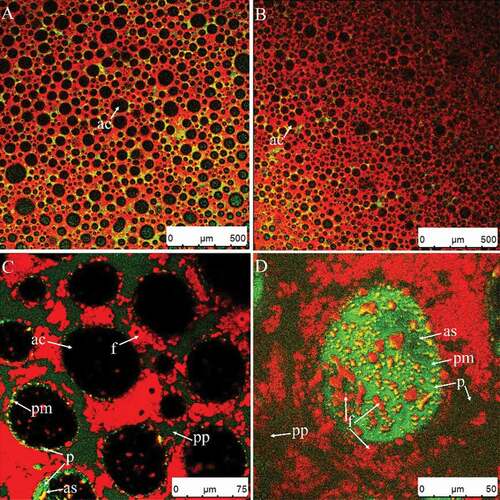
Figure 10. CSLM-micrographs of cream whipped for 30 s at low speed (950 rpm) then for 130 s at high speed (1100 rpm) (A–C). Red and green signals in plasma phase (pp) represent fat (f) and protein (p), respectively. Black or green circled areas are the center (ac) or surface (as) of air bubbles, respectively; green circles and area signals indicate protein membranes (pm).
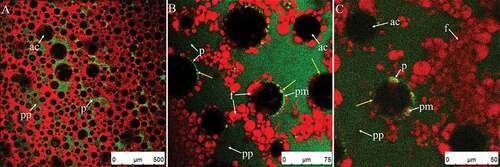
Figure 11. CSLM-micrographs of cream whipped for 70 s at high speed (1100 rpm) after sample reaches the endpoint (A–B). Red and green signals in plasma phase (pp) represent fat (f) and protein (p), respectively. Black or green circled areas are the center (ac) or surface (as) of air bubbles, respectively; green circles and area signals indicate protein membranes (pm).
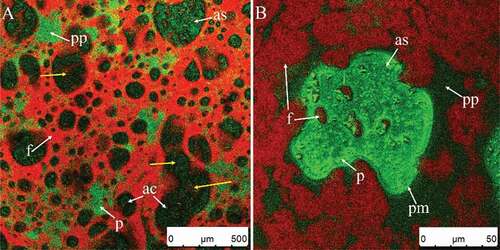
Figure 12. CSLM-micrograph of butter granule after whipping. Red or green signals in plasma phase (pp) represent fat (f) or protein(p), respectively.