Figures & data
Figure 9. The thawing performance of the different freezing rates: (a) 0.5°C/min, (b) 1.2°C/min, and (c) 2°C/min.
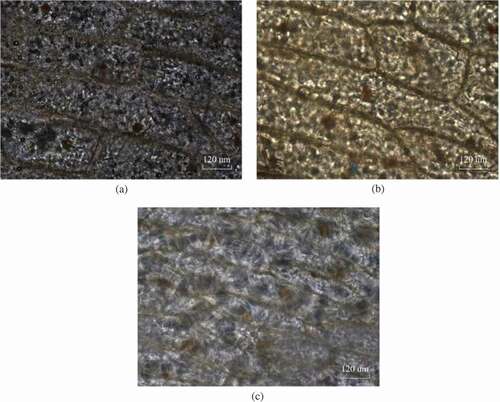
Figure 10. Cell plasmolysis after thawing at the different freezing rates: (a) 2°C/min, (b) 1.2°C/min, (c) 0.5°C/min, and (d) 0.1°C/min.
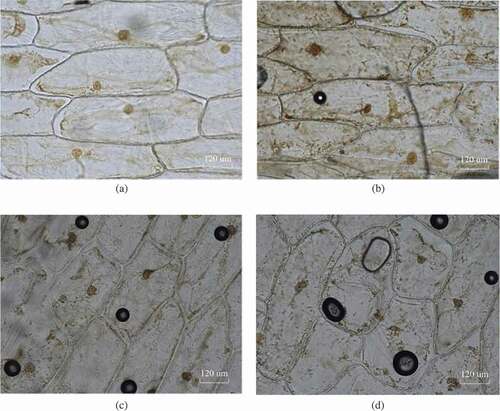
Table 1. Three experimental conditions.
Figure 1. The experimental setup.
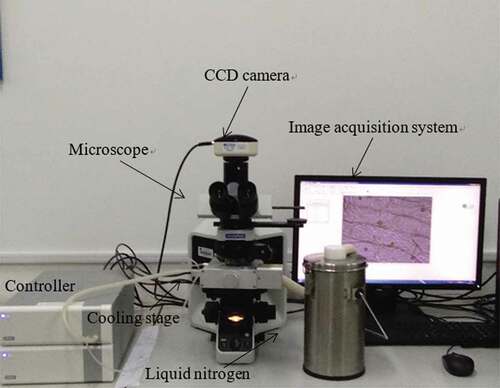
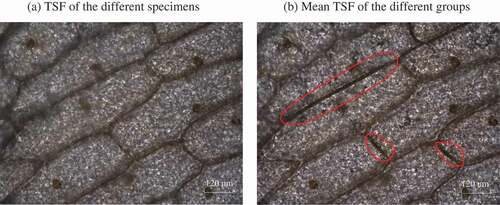
Figure 2. Location of the ice crystals formed at the freezing rate of 1.2°C/min.
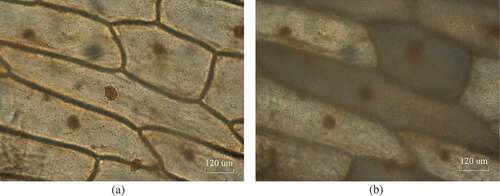
Figure 3. Ice crystal growth at different times after ‘flashing’ at the freezing rate of 1.2°C/min.
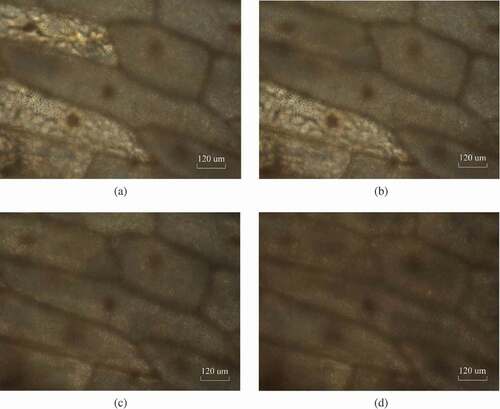
Figure 4. Ice crystal growth near the ‘flashing’ at the freezing rate of 2°C/min when the temperature was: (a) −9.2°C, (b) −9.6°C, (c) −9.8°C, and (d) −10°C.
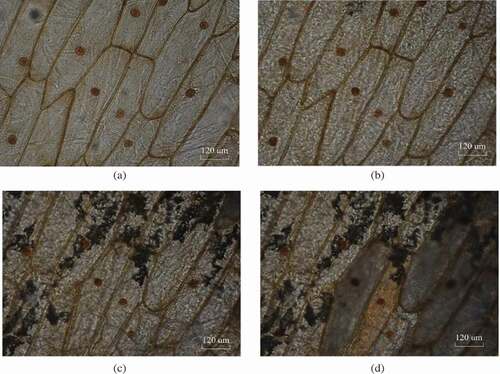
Figure 5. Ice crystal growth at a slower freezing rate. (a) 0.1°C/min, −16.7°C, (b) 0.1°C/min, −16.8°C, (c) 0.5°C/min, −10.5°C, and (d) 0.5°C/min, −11°C.
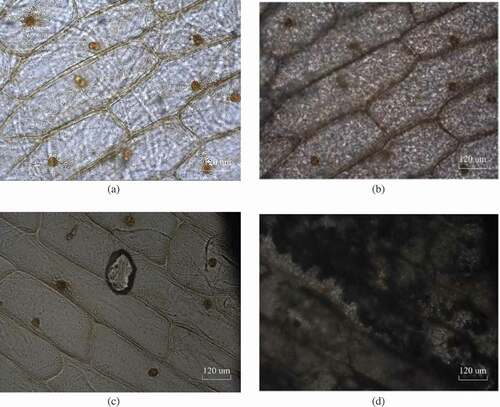
Figure 6. Grey changes at the moment of ‘flashing’ during the ice crystal formation process at a freezing rate of 1.2°C/min using the image processing method (the scale of each plot refers to the range of grey values for all the pixels in each image).
Figure 7. Temperature of spontaneous freezing of the onion epidermal cells at three different freezing rates.
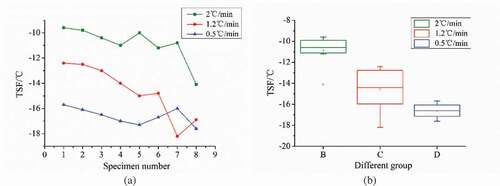
Figure 8. Changes of the cell wall gap in the frozen cells at a freezing rate of 0.1°C/min when the temperature was: (a) −16.8°C, (b) −17.3°C.