Figures & data
Table 1. Chemical analysis of different cereal starches (dwb).
Table 2. Swelling power (g/g) of different cereal starches.
Table 3. Solubilities (%) of various starches.
Table 4. Light transmittance % of starches from different cereals.
Figure 1. Pasting properties of starches from different cereals. (A) Wheat (WH-1105), (B) Rice (PR-123), (C) Oats (OL-9), (D) Maize (Super-777), (E) Barley (PL-426), (F) Sorghum (Sudex), and (G) Millets (FBC-16). η: viscosity and T: temperature.
Figure 2. Particle size distribution of starches from different cereals.
Figure 3. Scanning electron micrographs (SEM) of starches isolated from different cereals. (A) Wheat (WH-1105), (B) Rice (PR-123), (C) Oats (OL-9), (D) Maize (Super-777), (E) Barley (PL-426), (F) Sorghum (Sudex), and (G) Millets (FBC-16) (bar = 20 µm).
Table 5. X- ray diffraction spacing, intensities, and crystalline index of major peaks of different starches.
Figure 4. X-ray diffraction patterns of starches from different cereals.
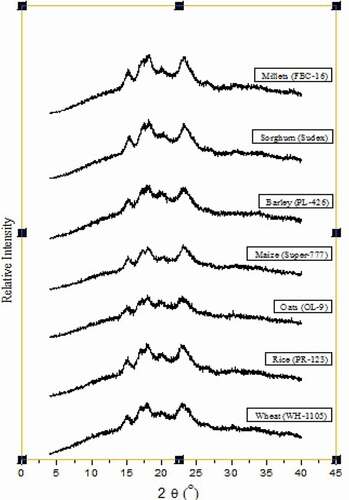
Figure 5. FTIR spectroscopy of starches from different cereals.
Table 6. In vitro digestibility of raw and cooked starch fractions from different cereal starches.
Table 7. Hydrolysis index and estimated glycemic index of raw and cooked starch fractions from different cereal starches.
Figure 6. (a) Principal component analysis: score plot of first principal component (PC 1) and second principal component (PC 2) describing the overall variation among properties of starches from different cereals. (b) Principal component analysis: loading plot of PC 1 and PC 2 describing the variation among properties of starches from different cereals. RDS, RDS (raw), SDS, SDS (raw), RS, RS (raw), GI, GI (raw), HI, HI (raw): rapidly digestible starch, slowly digestible starch, resistant starch, glycemic index and hydrolysis index of cooked and raw starches; SS 55, 65,75,85,95: solubilities of starches at 55, 65, 75, 85, and 95ºC; SP 85, 95: swelling power at 85 and 95ºC; SV: setback viscosity, PT: peak temperature, TV: trough viscosity, PV: peak viscosity, FV: final viscosity, CI: crystalline index, SG: starch granular size and 0, 24, 48, 72, 96, 120 h: light transmittance of starches after 0–120 h.