Figures & data
Table 1. Triacylglycerol composition and regiospecific distribution of the RDB palm oil.
Figure 1. Compatibility diagrams (a, c), hardness (b, d), and melting point of the palm oil (PO) and its blend with STS and S-370.
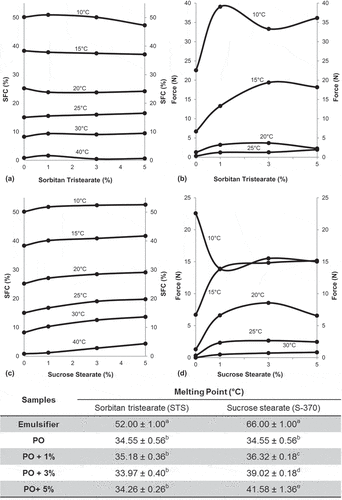
Figure 2. Microstructure (A1, B1, C1, D1, E1, F1, G1), three-dimensional structure (A2, B2, C2, D2, E2, F2, G2), and microstructural parameters (mean diameter, fractal dimension, and percentage of the crystallized area) of the palm oil (PO) and its blend with STS and S-370 at 20°C. The bar represents 200 μm.
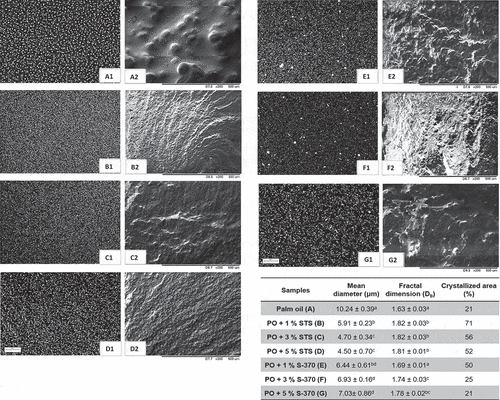
Figure 3. Isothermal crystallization of palm oil (PO) and its blend with either STS or S-370 (a, b), at temperature 20°C, and non-isothermal crystallization of the palm oil (PO) and its blend with either STS and S-370 (c, d).
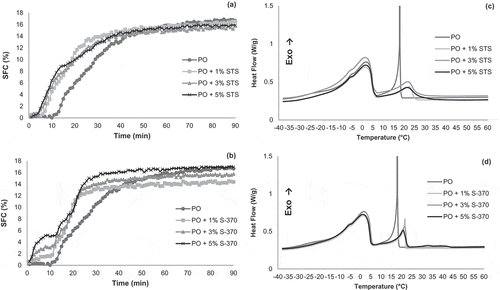
Figure 4. Melting behavior (a, c) and polymorphic behavior of the palm oil (PO) and its blend with either STS and S-370 (b, d).
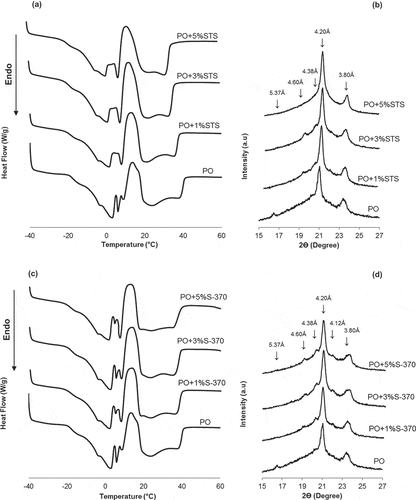
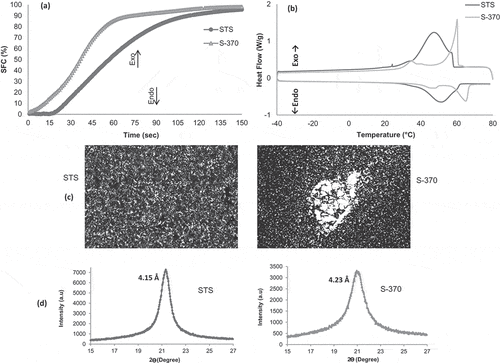
Figure 5. Crystallization characteristics of pure STS and S-370. Isothermal crystallization (a); thermal behavior (b); microstructure (c), the bar represents 10 μm; and polymorphic behavior (d).