Figures & data
Table 1. Flavour attributes selected for sensory evaluation.
Table 2. The comparison of different shelf life with the extraction method of SPME.
Table 3. The comparison of different shelf life with the extraction method of SAFE.
Figure 1. Sensory evaluation of different shelf life Sachima.
Figure 2. The content change in different storage shelf-life by extraction of SPME.
Figure 3. Linear partial least-squares analysis (PLS) biplot of sensory attributes versus prominent aroma-active compounds quantified by SPME-GC-MS (the prominent aroma-avitve compounds’numbers in biplot were 6, 11, 15, 16, 17, 19, 28, 37, 39, 49, 50, 52, 54, 56, 57, 62, which corresponding to , respectively.).
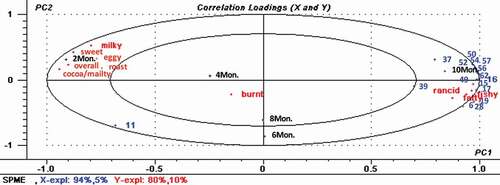
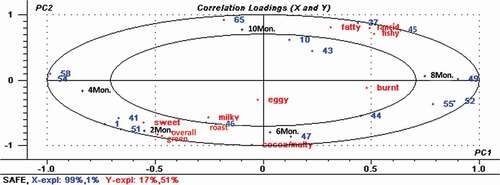
Figure 4. Linear partial least-squares analysis (PLS) biplot of sensory attributes versus prominent aroma-active compounds quantified by SAFE-GC-MS (the prominent aroma-acitve compounds’numbers in biplot were 1, 10, 37, 41, 43, 44, 45, 46, 47, 49, 51, 52, 54, 55, 58, 65, which corresponding to , respectively.).