
Figures & data
Table 1. Some average value of physical and mechanical properties of orange samples.
Figure 1. Quasi-static compression test of orange fruit using parallel plates: (a) before loading, (b) after loading.
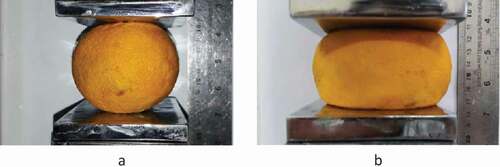
Figure 2. Measurement steps of Poisson’s ratio in MATLAB: (a) the length calibration by ruler, (b) image margin elimination, (c) point selection, and (d) longitudinal and transverse distance measurement.
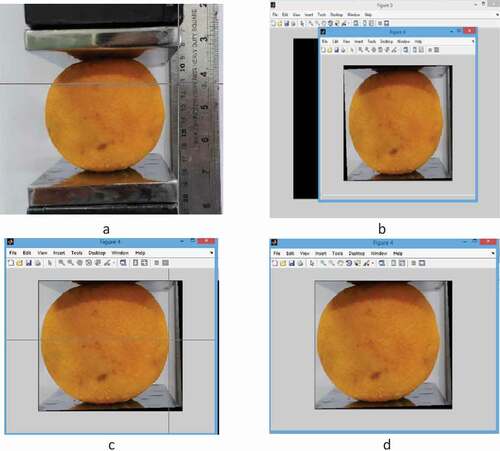
Figure 3. (a) Schematic drawings of parabolic tetrahedral solid elements, (b) mesh construction of the orange sample in SolidWorks.
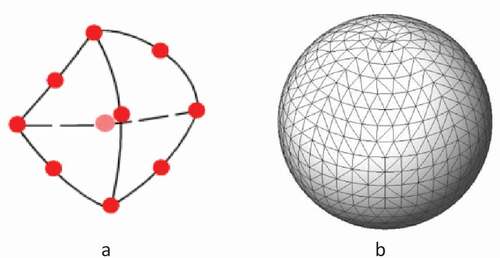
Figure 4. The drop test simulation setup for orange fruit.
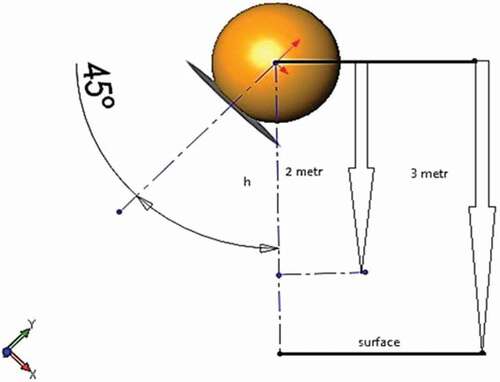
Figure 5. (a) Experimental dropping test setup: (1) axial load cell, (2) rigid plate connected to the load cell, and (3) and transmitter. (b) Determination of contact area for stress calculation after impact.
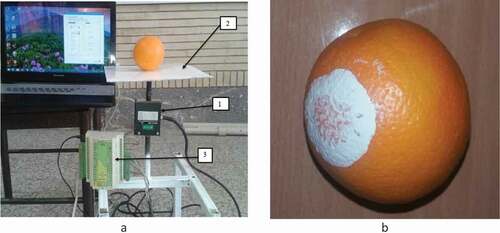
Figure 6. The magnitude of equivalent stress and contact force at different steps after impact (height of 2 m).
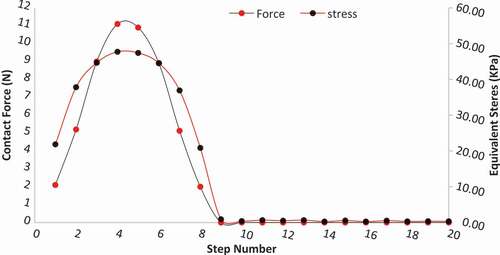
Figure 7. Stress distribution plots in orange sample after impact for the predefined dropping height (a) step 1, (b) step 7, (c) step 10, (d) step 13, (e) step 17, and (f) step 20, simulated by SolidWorks Software.
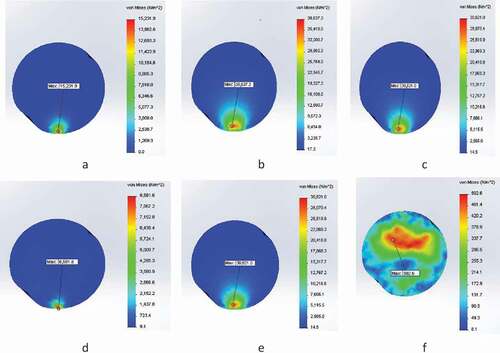
Figure 8. The magnitude of equivalent stress and contact force at different steps after impact (height of 3 m).
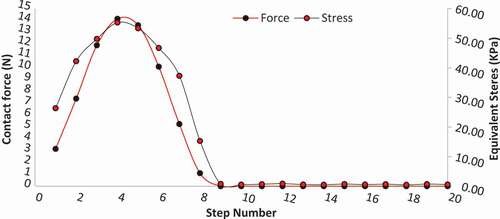
Figure 9. Stress distribution plots in orange sample after impact for the predefined dropping height (a) step 1, (b) step 7, (c) step 10, (d) step 13, (e) step 17, and (f) step 20, simulated by SolidWorks Software.
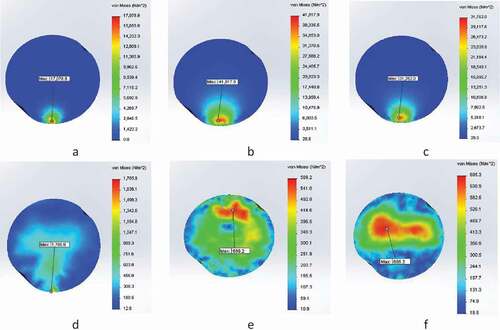
Table 2. The values of contact force, normal stress, height, and contact surface in the experimental tests.
Table 3. A comparison between experimental data and finite element simulation.