Figures & data
Table 1. Information of the mushroom samples.
Figure 1. Raw FT-IR spectrum (a) and spectrum preprocessed by 2D + SNV + SG (15:1) (b) of different species wild-grown Boletaceae mushrooms.
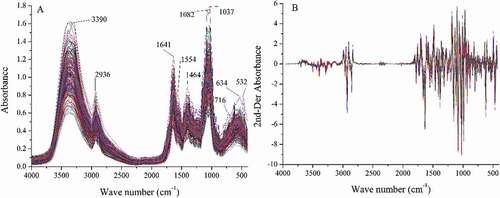
Table 2. The results of mineral concentrations determined in five species mushrooms (mean ± SD, mg kg−1).
Figure 2. Latent variables number and R2Y, Q2 values.
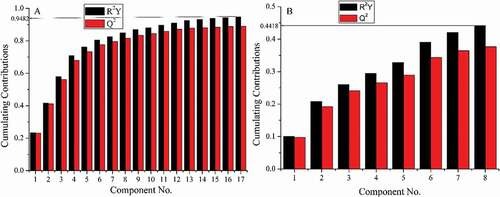
Table 3. The optimization results for parameters c and g by grid-search method.
Figure 3. The optimization results for parameters (c and g) and cross-calidation accuracy by grid-search method with mid-level data fusion strategy. A: FT-IR spectra; B: element concentrations.
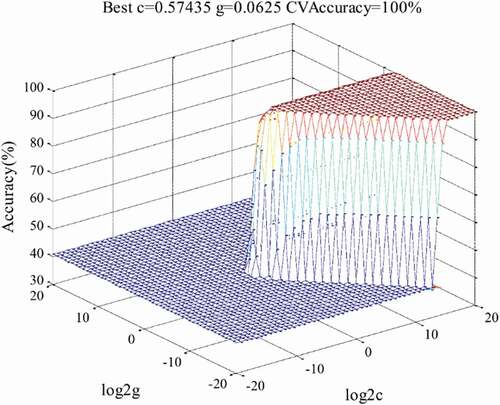
Table 4. The results of SVM models on different data matrices.
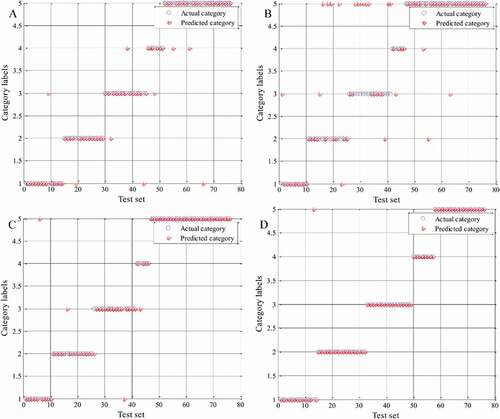
Figure 4. The plot of actual and predicted category of test samples by support vector machine.
A: FT-IR spectra; B: element concentrations; C: low-level data fusion; D: mid-level data fusion.