Figures & data
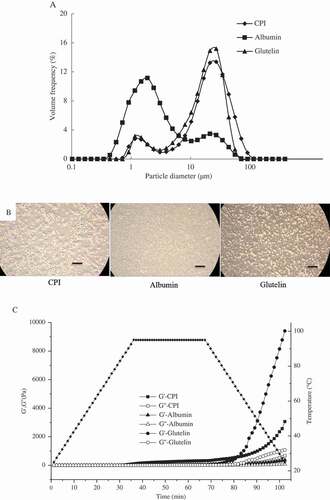
Figure 1. SDS-PAGE patterns of CPI and cumin protein fractions. M, marker standard; A, under non-reducing condition (without β-mercaptoethanol) for CPI (lane 1), albumin (lane 2), globulin (lane 3), and glutelin (lane 4); B, under reducing condition (with β-mercaptoethanol) for CPI (lane 5), albumin (lane 6), globulin (lane 7), and glutelin (lane 8).
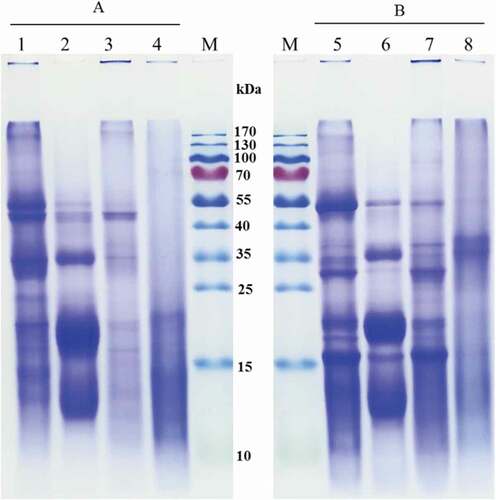
Table 1. Amino acid compositions of cumin protein isolate (CPI) and cumin protein fractions (g/100g protein).
Figure 2. Far-UV CD (190–240 nm) spectra (A) and intrinsic fluorescence spectra (B) of CPI, albumin, and glutelin in 10 mM phosphate buffer (pH 7.0) at a concentration of 0.1 mg/mL.
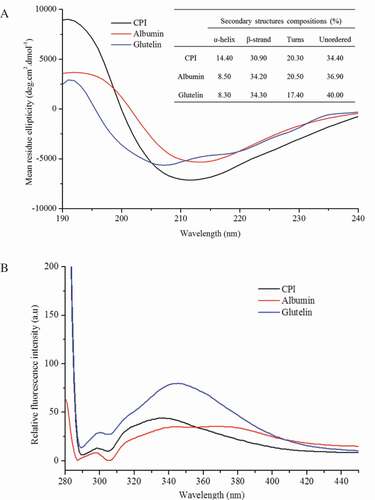
Figure 3. 3D-view and typical top-view AFM images of CPI (A and B), albumin (C and D), and glutelin (E and F). Scan area was 5 μm×5 μm.
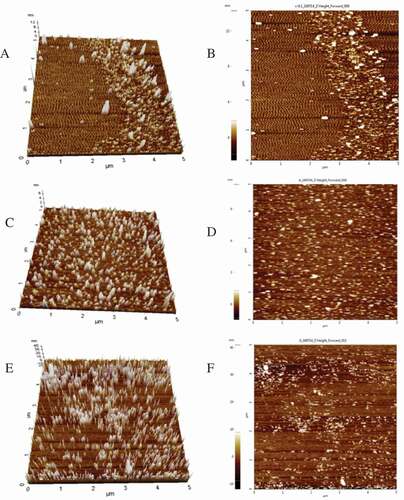
Table 2. Ho, ζ, Dh, EAI, and ESI of CPI, albumin, and glutelin and d4,3 of their emulsions at a protein concentration of 0.1% (w/v).
Figure 4. Protein solubility curves of CPI, albumin, and glutelin at different pH values.
Figure 5. Particle distribution (A), optical microscopy images (B) of emulsions stabilized by CPI, albumin, and glutelin at a concentration of 0.1% (w/v), and changes in storage modulus (G′) and loss modulus (G″) of 10% (w/v) CPI, albumin, and glutelin dispersion with time and temperature (C). The bar accounts for 100 μm.