
Figures & data
Table 1. Fatty acid compositions (%) of the raw materials, high oleic sunflower (SO), fully hydrogenated high oleic sunflower oil (FHSO), and the binary blends (SO:FHSO).
Table 2. TAG composition (%) of high oleic sunflower (SO) and fully hydrogenated high oleic sunflower oil (FHSO), blend (BE), and after chemical (CI) and enzymatic interesterification (EI).
Table 3. Acylglycerides composition (%), triacylglycerol (TAG), diacylglycerol (DAG), and monoacylglycerol (MAG) of the blends (BE) and the after chemical (CI) and enzymatic interesterification (EI).
Table 4. Distribution of the fatty acids (%) at the sn-2, sn-1,3 positions on the TAG in the blend (BE), after chemical (CI) and enzymatic interesterification (EI).
Figure 1. Solid fat content (%) of high oleic sunflower (SO) and fully hydrogenated high oleic sunflower oil (FHSO) blend (BE) (▲), after chemical (CI) (x) and enzymatic interesterification (EI) (■).
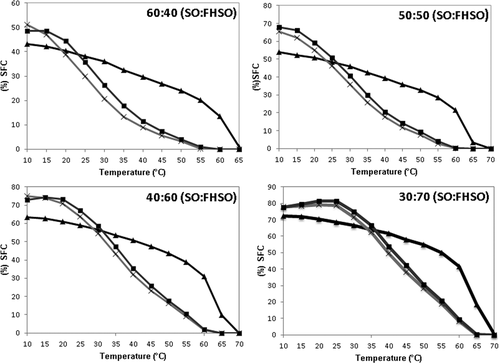
Figure 2. The crystallization profiles of high oleic sunflower (SO) and fully hydrogenated high oleic sunflower oil (FHSO) blend (BE), after chemical (CI) and enzymatic interesterification (EI).
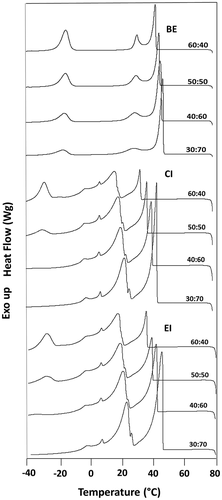
Figure 3. Microscopy of high oleic sunflower (SO) and fully hydrogenated high oleic sunflower oil (FHSO) blends (BE), after chemical (CI) and enzymatic interesterification (EI) at 25°C/24h with x40 amplification. Proportions 60:40 (1-3), 50:50 (4 -6), 40:60 (5-7) and 30:70 (8-10).
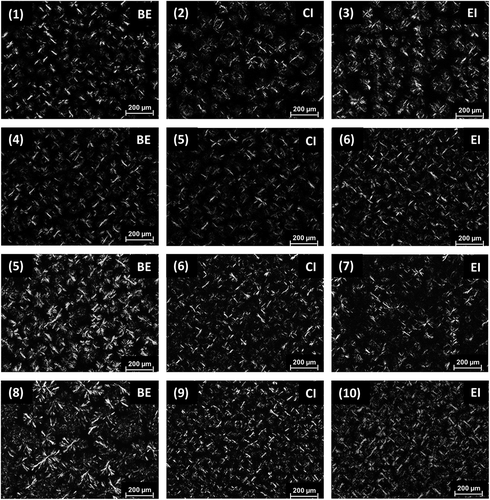
Figure 4. X-ray diffraction of high oleic sunflower (SO) and fully hydrogenated high oleic sunflower oil (FHSO) (50:50 / 30:70) blend (BE), after chemical (CI) and enzymatic interesterification (EI) at 25°C/24h.
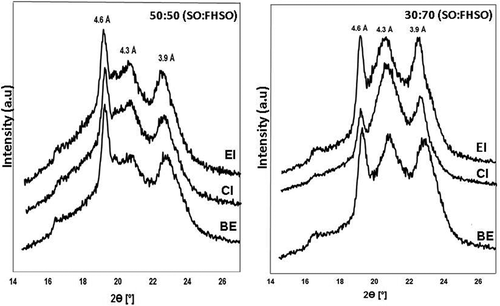
Table 5. Polymorphic forms of the blends before (BE) and the after chemical (CI) and enzymatic interesterification (EI), obtained at 25°C for 24 h.