Figures & data
Figure 1. Molecular structure and ball-and-stick model of acteoside.
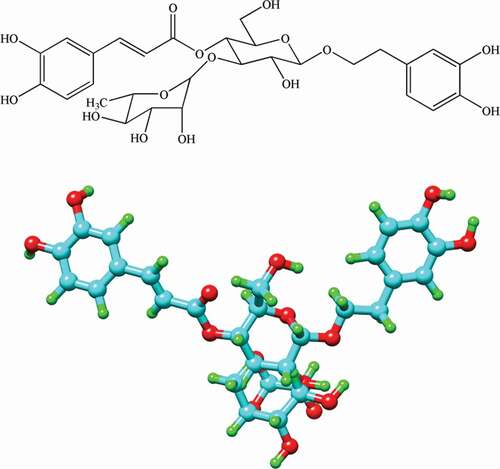
Figure 2. Ultraviolet visible absorption spectra of trypsin in absence and presence of acteoside at different concentrations. c(trypsin) = 2.50 × 10⁻⁷ mol L−1. Concentrations of acteoside from a to k are 0, 0.67, 1.33, 2.00, 2.67, 3.33, 4.00, 4.67, 5.33, 6.00, 6.67 (×10–6 mol L−1), respectively.
Figure 3. Positions of tryptophan (a) and tyrosine (b) residues in three-dimensional structure of trypsin.
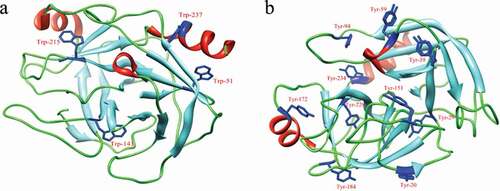
Figure 4. Fluorescence spectra of 2.50 × 10⁻⁷ mol L−1 trypsin in absence and presence of acteoside in phosphate buffer (pH 8.0) at 310 K, c(acteoside) (a–k): 0, 0.67, 1.33, 2.00, 2.67, 3.33, 4.00, 4.67, 5.33, 6.00, 6.67 (×10–6 mol L−1), respectively.
Table 1. Quenching constants for acteoside-trypsin-system at different temperatures.
Table 2. Binding parameters of acteoside to trypsin at different temperatures.
Figure 5. (a) Van’t Hoff plots of lnKa versus 1/T; (b) bar diagram showing thermodynamic parameters (T = 298 K) for binding of acteoside to trypsin.
Figure 6. Synchronous fluorescence spectra of trypsin with different concentrations of acteoside, (a) Δλ = 15 nm, (b) Δλ = 60 nm, pH = 8.0, c(trypsin) = 2.50 × 10⁻⁷ mol L−1, c(acteoside) (a–k): 0, 0.67, 1.33, 2.00, 2.67, 3.33, 4.00, 4.67, 5.33, 6.00, 6.67 (×10–6 mol L−1); (c) Quenching of trypsin synchronous fluorescence by acteoside, pH = 8.0, c(trypsin) = 2.50 × 10⁻⁷ mol L−1, x-axis represents the concentration of acteoside.
Table 3. Effect of acteoside on secondary structure content of trypsin.
Figure 7. Circular dichroism spectra of trypsin and trypsin–acteoside complexes. c(trypsin) = 2.50 × 10⁻⁷ mol L−1.
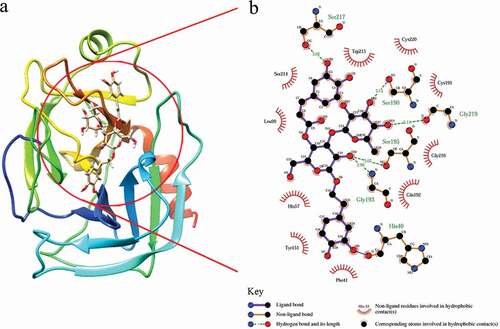
Figure 8. (a) Best docked conformation of trypsin–acteoside complex, acteoside is shown as stick model; (b) two-dimensional illustration (generated by LIGPLOT) of interaction of amino acid residues with acteoside.