Figures & data
Figure 1. Average spectra (log 1/R) of minced and intact samples using a nexus FT-NIR spectrometer.
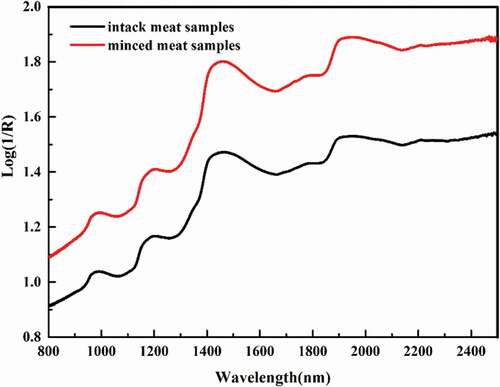
Figure 2. Averaged spectra of minced meat samples using a USB4000 spectrometer.
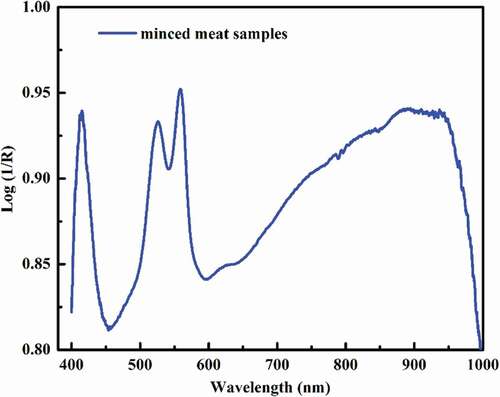
Table 1. Statistics for IMF content of minced meat using PLSR and LS-SVM models based on NIR spectra.
Figure 3. Relationship between the measured values and the predicted value of IMF content by the NIRS technique for both calibration (a) and the validation (b) sets of minced meat samples by the original minced meat spectra using LS-SVM.
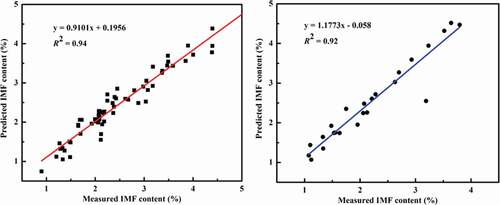
Table 2. Statistics for IMF content of intact meat using PLSR and LS-SVM models based on NIR spectra.
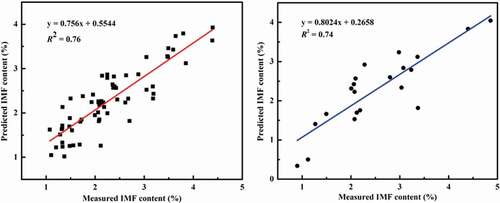
Figure 4. Relationship between the measured values and the predicted value of IMF content by the NIRS technique for both calibration (a) and the validation (b) sets of intact meat samples by PLSR with MSC pretreatment.
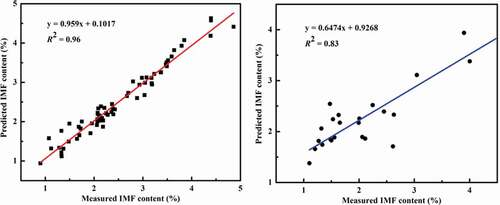
Table 3. Statistics for IMF content of minced meat using PLSR and LS-SVM models based on Vis-NIR spectra.
Figure 5. Relationship between the measured values and the predicted value of IMF content by the Vis-NIRS technique for both calibration (a) and the validation (b) sets of minced meat samples by PLSR with OSC pretreatment.