Figures & data
Figure 1. Effect of salt on WHC of turbot (mean ± SD, n = 4). *Different letters indicate significant differences (p < 0.05) between treatments.
Figure 2. Effect of salt on hardness of turbot (mean ± SD, n = 4). *Different letters indicate significant differences (p < 0.05) between treatments.
Figure 3. Effect of salt on elasticity of turbot (mean ± SD, n = 4). *Different letters indicate significant differences (p < 0.05) between treatments.
Table 1. NMR parameters obtained from different treatments with turbot.
Figure 4. T2 relaxation spectra for turbot during different concentrations of salting.
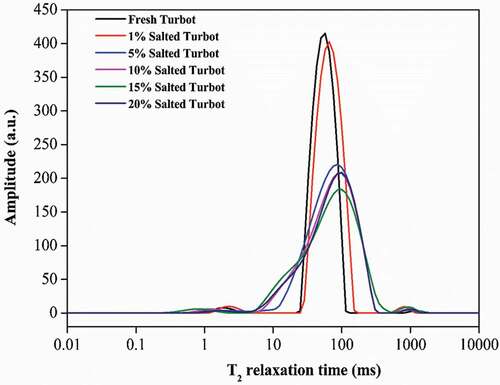
Figure 5. Effect of salt on the longitudinal section muscle of turbot.
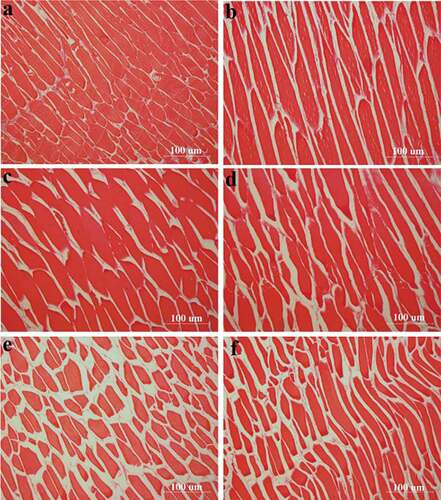
Table 2. Least-square means of histological variables as affected by salt concentration.
Table 3. The correlation analysis of low-field NMR, WHC, TPA, and histology microstructure data.
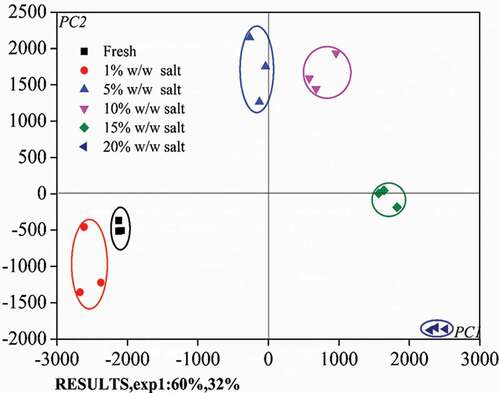
Figure 6. Results of the PCA—score plots in the PC1 vs. PC2 plane for all samples tested.