Figures & data
Figure 1. Degradation curve of AFB1 at different initial concentrations in the peanut meal.
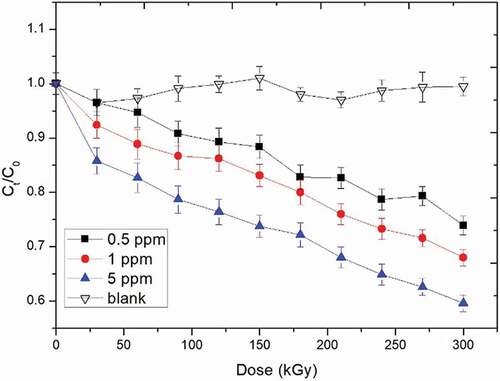
Figure 2. Degradation curve of AFB1 at different moisture contents in the peanut meal.
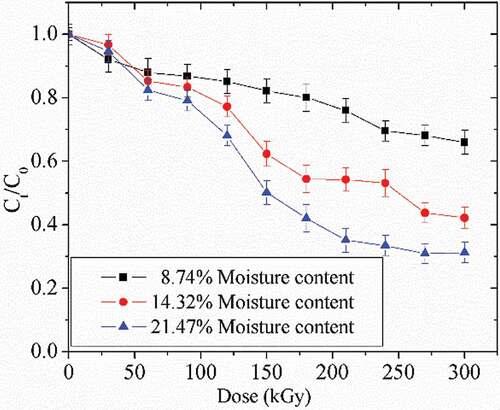
Table 1. Parametric equations of AFB1 degradation at different initial concentrations in the peanut meal.
Figure 3. Kinetics of AFB1 at different initial AFB1 and moisture content in the peanut meal.
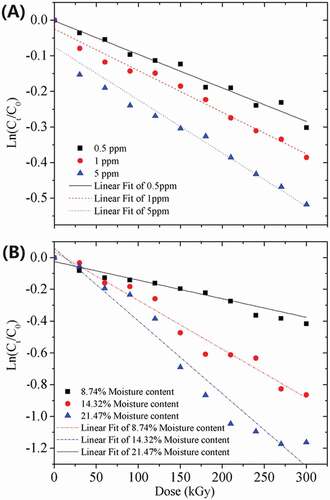
Figure 4. UPLC chromatograms of the AFB1 degraded products in the peanut meal.
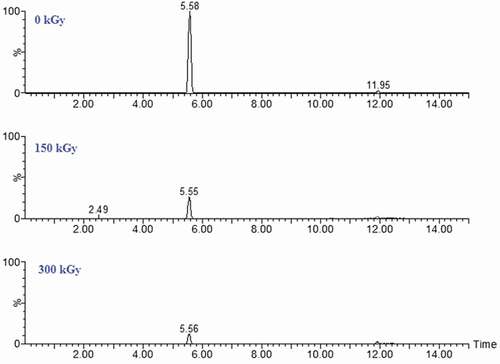
Figure 5. The proposed degradation pathway of AFB1 in the peanut meal.
Figure 6. Revertant of Salmonella trphimurium tester strains TA98(A) and TA100(B) of AFB1 and the degradation in the peanut meal. *p < 0.05, **p < 0.001 versus AFB1.
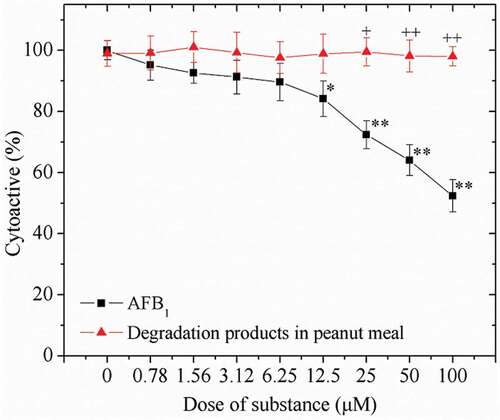
Figure 7. Effect of AFB1 concentration and its degraded products in the peanut meal on the viability of HepG2 cells. *p < 0.05, **p < 0.01 versus medium; +p < 0.01, ++p < 0.001 versus AFB1-treated cells.