Figures & data
Figure 1. Changes of quality-related events in Patinopecten yessoensis adductor muscle (PYAM) during the heat treatment of 45°C and 65°C. (A) Moisture content; (B) hardness; (C) cohesiveness; (D) L*; (E) a*; (F) b*. Data is reported as mean ± SD based on 10 replicates. Different letters indicated significant differences (p < 0.05).
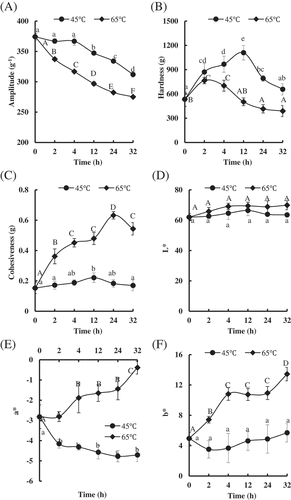
Figure 2. Changes in protein degradation and endogenous enzyme activities in Patinopecten yessoensis adductor muscle (PYAM) during the heat treatment of 45°C and 65°C. (A) SDS-PAGE photographs of protein degradation under the heat treatment of 45°C; (B) SDS-PAGE photographs of protein degradation under the heat treatment of 45°C; 5 μL sample was loaded in 10% (w/v) SDS-PAGE gel; HM: high MARK; LM: low MARK; (C) cathepsin L activity measured by a fluorospectrophotometer. Data is reported as mean ± SD based on three replicates. Different letters indicated significant differences (p < 0.05).
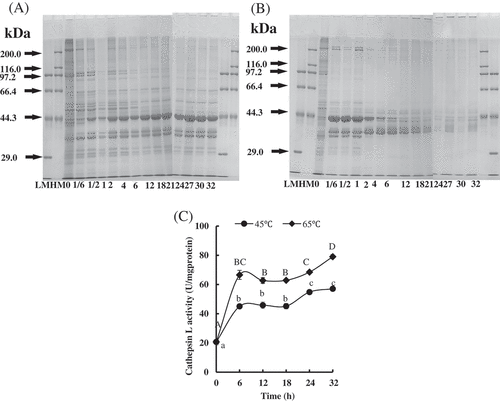
Figure 3. Changes in oxidation in Patinopecten yessoensis adductor muscle (PYAM) during the heat treatment of 45°C and 65°C. (A) Carbonyl content; (B) total sulfhydryl group content; (C) MDA content. They were detected by a spectrophotometry. Data is reported as mean ± SD based on three replicates. Different letters indicated significant differences (p < 0.05).
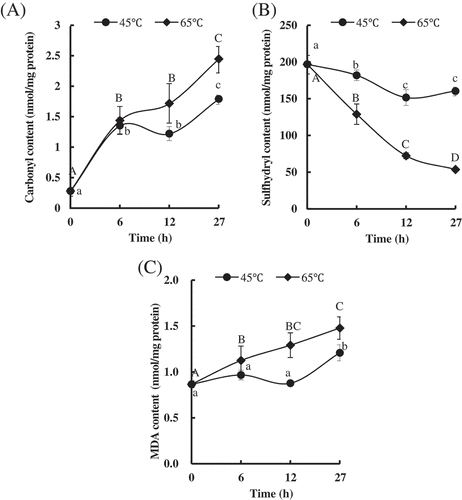
Figure 4. Changes in antioxidant enzymes in Patinopecten yessoensis adductor muscle (PYAM) during the heat treatment of 45°C and 65°C. (A) Total superoxide dismutase activity; (B) catalase activity; (C) GSH-Px activity. Data is reported as mean ± SD based on three replicates. Different letters indicated significant differences (p < 0.05).
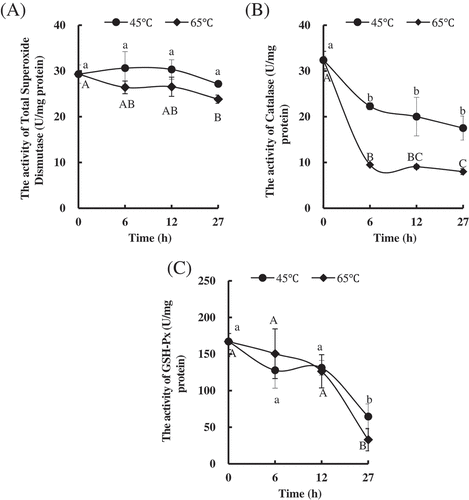
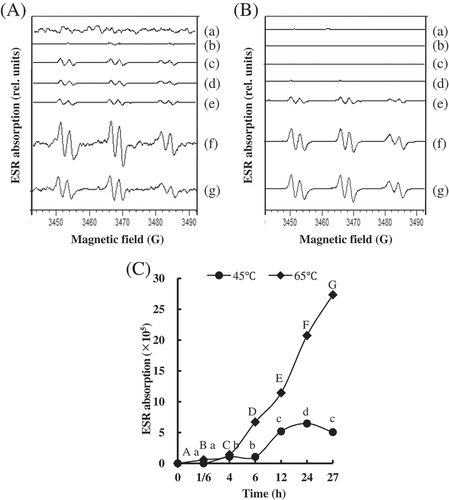
Figure 5. Changes in production of free radicals in Patinopecten yessoensis adductor muscle (PYAM) during the heat treatment of 45°C and 65°C. (A) ESR spectra of the PYAM sample homogenate with 40 mM POBN during the heat treatment of 45°C; (B) ESR spectra of the PYAM sample homogenate with 40 mM POBN during the heat treatment of 65°C; (C) diagram of ESR absorption of the PYAM sample homogenate with 40 mM POBN. (a) 0 h, (b) 1/6 h, (c) 4 h, (d) 6 h, (e) 12 h, (f) 24 h, and (g) 27 h. Different letters mean differences (p < 0.05).