Figures & data
Table 1. Thickness and water vapour permeabilities of the rabbit skin gelatin films and porcine skin gelatin films.
Table 2. Colour parameters of the rabbit skin gelatin films and porcine skin gelatin films.
Figure 1. Visual appearance of the films. a) RG films; b) PG films.
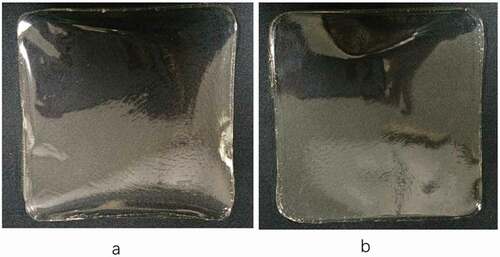
Table 3. Light transmission (%) and transparency of the rabbit skin gelatin films and porcine skin gelatin films.
Figure 2. Protein patterns of the RG films and PG films. RG1, RG2, RG3: RG films 4 g + 22%, 4 g + 30%, 5 g + 30%. PG1, PG2, PG3: PG films 4 g + 22%, 4 g + 30%, 5 g + 30%.
Table 4. Water solubility of the RG and PG films.
Table 5. TS, EAB and YM of the RG films and PG films.
Table 6. Amide band position of the RG films and PG films.
Table 7. Secondary structure contents of the rabbit skin gelatin films and porcine skin gelatin films.
Figure 3. FT-IR spectra of the RG films.
Figure 4. FT-IR spectra of the PG films.
Figure 5. Fourier second-derivative and curve-fitting of the amide-I region (1700–1600 cm−1) for the RG (Lower case letters) and PG (Uppercase letter) gelatin films.
Figure 6. Scanning electron microscopy of the surfaces of the films.a)RG:4 g + 22%; b) RG:4 g + 30%; c) RG:5 g + 30%; d) PG:4 g + 22%; e) PG:4 g + 30%; f) PG:5 g + 30%.
Figure 7. Scanning electron microscopy of the cross-sections of the films. a) RG:4 g + 22%; b) RG:4 g + 30%; c) RG:5 g + 30%; d) PG:4 g + 22%; e) PG:4 g + 30%; f) PG:5 g + 30%.