Figures & data
Table 1. MIC results of bayberry extract.
Figure 1. Antibacterial of different solvent bayberry extracts.
Different capital letters in the figure represent the abbreviation of different bacteria.
Figure 2. The contents of active components from bayberry extract.
Figure 3. The UV-Vis absorption spectrum and UPLC-UV spectrum of BEP.
Blue represents diluted once; green represents diluted twice; red represents dilution three times.
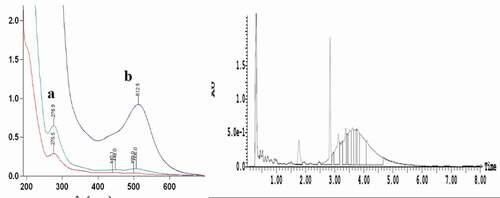
Figure 4. The analysis of UPLC-ESI-MS spectrum of BEP.
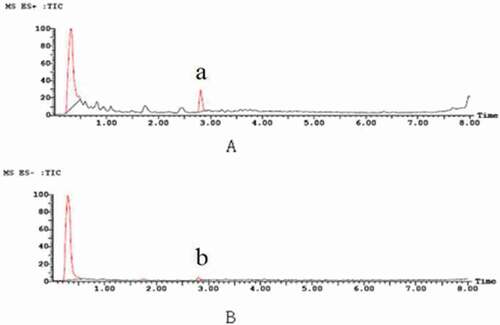
Figure 5. The analysis of MS spectrum of BEP.
A: positive ion mode (ES+); B: negative ion mode (ES−).