Figures & data
Figure 1. Typical AFM height images of SA self-assembly in six different concentrations at 512 × 512 pixels. Scale bar: 500 nm. Concentration of SA solutions: (a) 0.001 mg/ml; (b) 0.005 mg/ml; (c) 0.02 mg/ml; (d) 0.05 mg/ml; (e) 0.08 mg/ml; (f) 0.10 mg/ml.
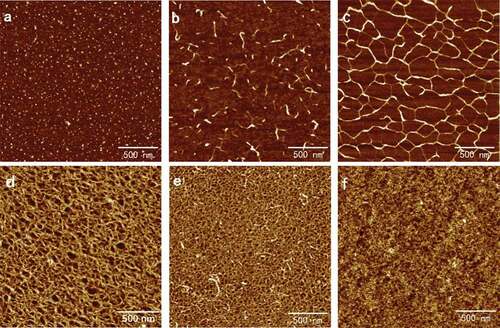
Figure 2. Root mean square roughness (Rq) of the self-assembly images of SA collected in different concentration.
Figure 3. Typical AFM height images of 0.02 mg/ml SA self-assembly in CaCl2 solutions with different ions concentration in 512 × 512 pixels. Scale bar: 500 nm. Concentration of CaCl2 solutions: (a) 0.1 mmol/l; (b) 1 mmol/l; (c) 2 mmol/l; (d) 3 mmol/l; (e) 5 mmol/l; and (f) 10 mmol/l.
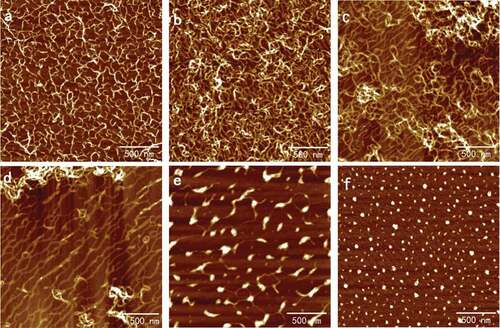
Figure 4. Typical AFM height images of 0.10 mg/ml SA self-assembly in presence of CaCl2 solutions with different concentration in 512 × 512 pixels. Scale bar: 500 nm. Concentration of CaCl2 solutions: (a) 0.1 mmol/l; (b) 1 mmol/l; (c) 2 mmol/l; (d) 3 mmol/l; (e) 5 mmol/l; and (f) 10 mmol/l.
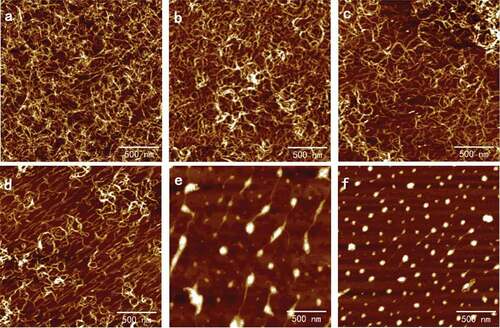
Figure 5. The diameter and density of the network holes and particles of SA self-assembly interacted with calcium chloride in different concentrations. (a) The diameter of the holes; (b) the density of the holes; (c) the diameter of the particles; and (d) the density of the particles.
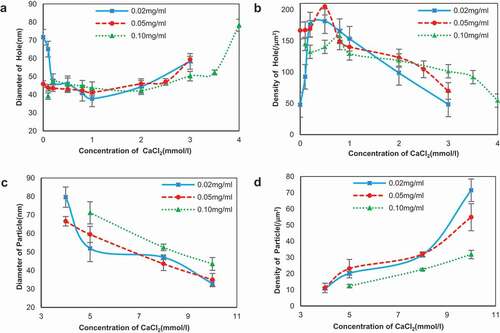
Figure 6. Root mean square roughness (Rq) of the self-assembly images of SA changed along with different concentration of calcium chloride. Concentration of SA: 0.02 mg/ml (blue line), 0.05 mg/ml (red line), and 0.10 mg/ml (green line).
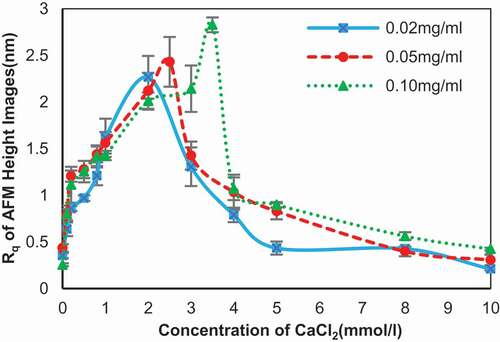
Figure 7. Width of the network chains (n = 60) of the self-assembly of 0.02 mg/ml SA in the presence of CaCl2 in different concentration. The ordinate refers to the diameter count in each interval.
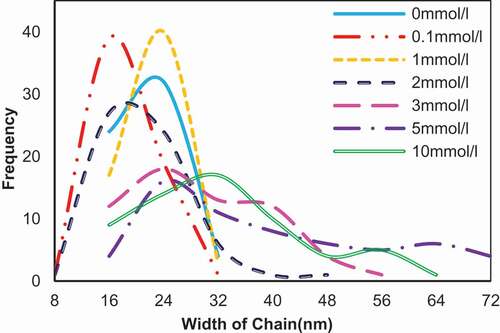
Figure 8. Viscosity of the SA solution in the presence of different concentration of CaCl2.
Concentration of SA: 0.02 mg/ml (blue line), 0.05 mg/ml (red line), and 0.10 mg/ml (green line).
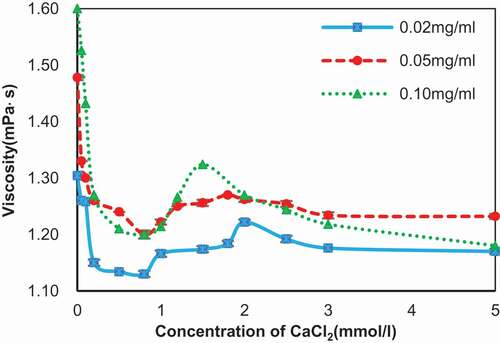
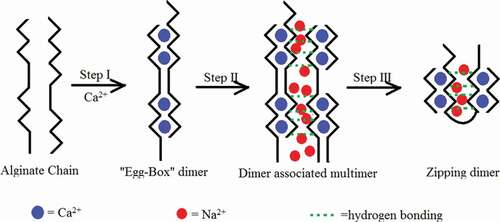
Figure 9. Hypothesized model of three-step binding of calcium ions to alginate molecules.
The black zigzag lines, black smooth lines, dotted green lines, blue dots, and red dots stand for G-blocks in alginate, M-blocks in alginate, hydrogen bond, calcium ions, and sodium ions, respectively.