Figures & data
Table 1. Height, roughness (Ra, Rq), and surface area difference of the chitosan molecular self-assembly in different chitosan concentrations and 0.05 mg/mL chitosan self-assembly in different KCl, NaCl, MgCl2, and CaCl2 concentrations.
Figure 1. Typical AFM height images and section analysis profiles of chitosan self-assembly in different concentrations in 512 × 512 pixels. Scale bar = 1um.
(a) 0.01 mg/mL; (b) 0.02 mg/mL; (c) 0.05 mg/mL; (d) 0.1 mg/mL.
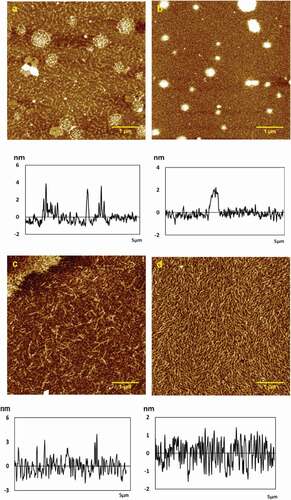
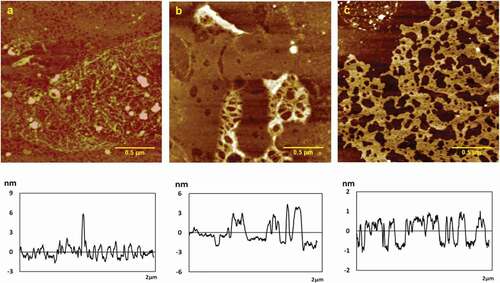
Figure 2. Typical AFM height images of chitosan self-assembly in KCl solution with different ions concentration in 512 × 512 pixels. Scale bar = 500nm. (a) 0.2 mg/mL; (b) 0.5 mg/mL; (c) 1.0 mg/mL.
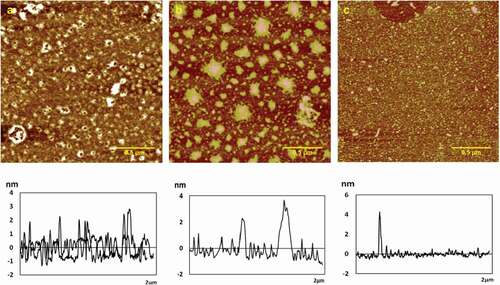
Figure 3. Typical AFM height images of chitosan self-assembly in NaCl solution with different ions concentration in 512 × 512 pixels. Scale bar = 500nm. (a) 0.2 mg/mL; (b) 0.5 mg/mL; (c) 1.0 mg/mL.
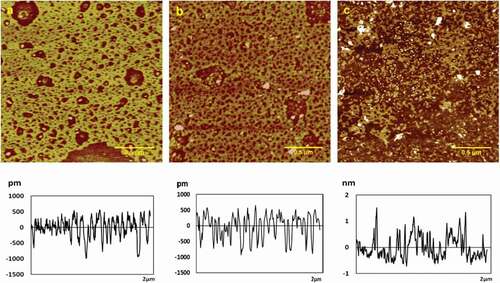
Figure 4. Typical AFM height images of chitosan self-assembly in MgCl2 solution with different ions concentration in 512 × 512 pixels. Scale bar = 500nm. (a) 0.2 mg/mL; (b) 0.5 mg/mL; (c) 2.0 mg/mL.
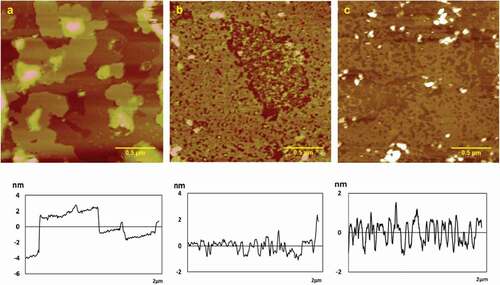
Figure 5. Typical AFM height images of chitosan self-assembly in CaCl2 solution with different ions concentration in 512 × 512 pixels. Scale bar = 500 nm. (a) 0.2 mg/mL; (b) 0.5 mg/mL; (c) 1.0 mg/mL.