
Figures & data
Figure 1. Percent yield of Ficus benjamina leaf extracts using 40, 60, 80, and 100% ethanol. Different letters describe significance difference (p < 0.05) between different groups.
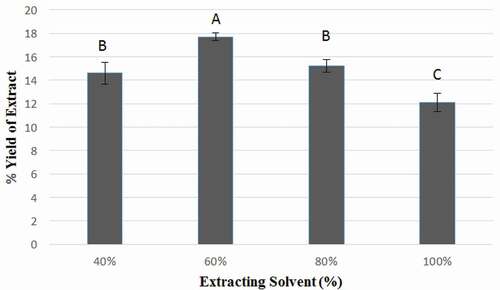
Figure 2. % DPPH scavenging by ethanolic Ficus benjamina leaf extracts (EFBE) and Butylated hydroxyanisole (BHA) at different concentrations.
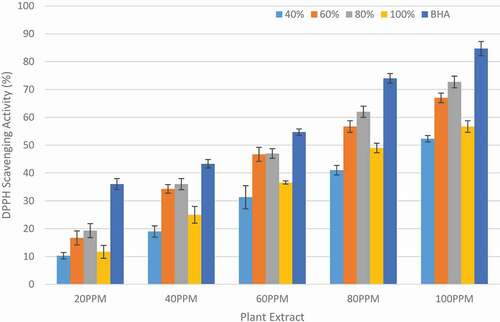
Figure 3. IC50 (μg/mL) for DPPH scavenging by ethanolic Ficus benjamina leaf extracts (EFBE) and Butylated hydroxyanisole (BHA). Different letters describe significance difference (p < 0.05) between different groups.
Table 1. IC50 (µg/mL) values of different ethanolic Ficus benjamina leaf extracts (EFBE) towards α-glucosidase and α-amylase inhibitions.
Figure 4. (A) Percent α-glucosidase inhibition activity (B) Percent α-amylase inhibition activity of ethanolic Ficus benjamina leaf extracts (EFBE) at different concentrations.
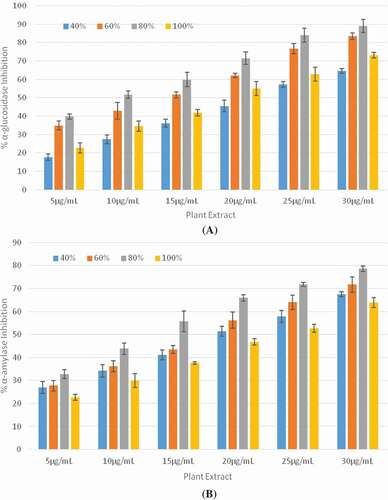
Figure 5. 1H-NMR spectra of 80% Ficus benjamina leaf extract.
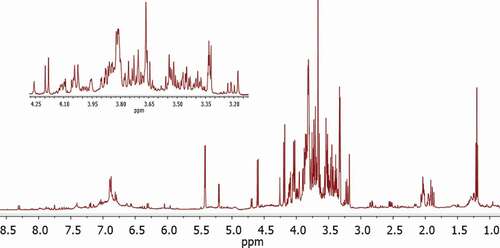
Figure 6. UHPLC-QTOF-MS/MS chromatogram of 80% Ficus benjamina leaf extract.
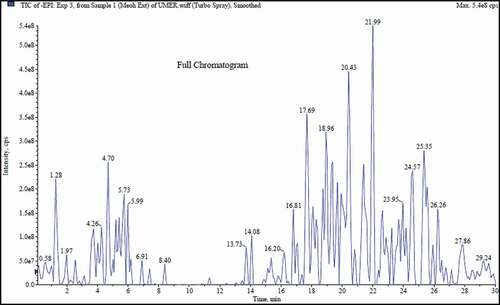
Table 2. Metabolites identified in 80% ethanolic leaf extract of Ficus benjamina.