
Figures & data
Figure 1. RGB and grayscale images at 811 nm of intact and bruise apples.
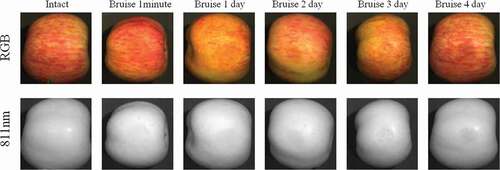
Figure 2. Hyperspectral reflectance imaging system and hyperspectral image structure schematic diagram.
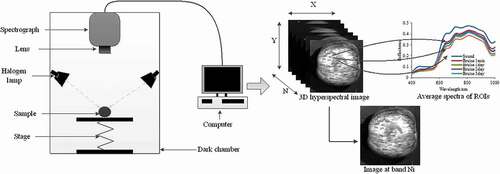
Figure 3. The initial and pretreated spectra reflectance of intact and bruise apple at different time intervals after injury.
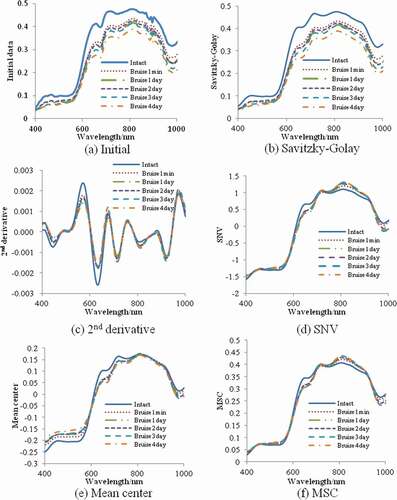
Table 1. Classification results based on full wavelengths and AdaBoost.
Figure 4. The confusion matrix for the training results of the initial data.
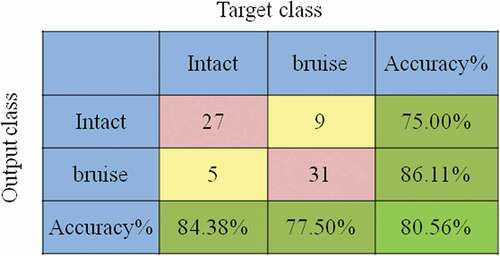
Table 2. The results of CFS procedure performed on Initial data and preprocessed data.
Table 3. Classification results based on selected wavelengths and AdaBoost.
Figure 5. ICA transform results of the bruise apples’ hyperspectral images based on the full and characteristic wavelengths. (a) The first four component images of ICA transform based on full wavelengths.(b) The first four component images of ICA transform based on characteristic wavelengths
Figure 6. Flow chart of apple bruise region detection algorithm.
Table 4. Detection results of apple slight bruise by image recognition.