Figures & data
Figure 1. Changes in EC of olive flounder during chilled storage for 15 days. Data are the mean of triple replicates and vertical bars indicate ± SD.
Figure 2. Changes in shear force of olive flounder during chilled storage for 15 days. Data are the mean of triple replicates and vertical bars indicate ± SD.
Figure 3. Changes in TCA-soluble peptides of olive flounder during chilled storage for 15 days. Data are the mean of triple replicates and vertical bars indicate ± SD.
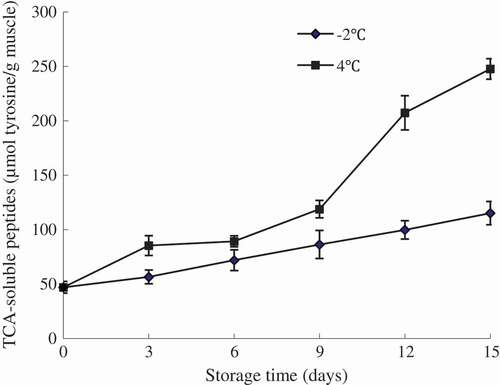
Table 1. Changes in FAA (mg/100g sample) content of olive flounder during chilled storage for 15 days.
Figure 4. Changes in proteolysis index of olive flounder during chilled storage for 15 days. Data are the mean of triple replicates and vertical bars indicate ± SD.
Figure 5. Changes in microstructure of olive flounder muscle during storage at −2°C (a) and 4°C (b) for 15 days. Arrows indicated gapping of muscle fibres.
Figure 6. SDS-PAGE pattern of olive flounder muscle proteins during chilled storage for 15 days (a: MFP samples at −2°C; b: SSP samples at −2°C; c: MFP samples at 4°C; d: SSP samples at 4°C).