Figures & data
Table 1. Total phenolic and total flavonoid content of ethyl acetate fraction of Cnidoscolus aconitifolius leaves.
Table 2. Phenolic constituents of ethyl acetate fraction of Cnidoscolus aconitifolius leaves.
Figure 1. Representative high-performance liquid chromatography profile of ethyl acetate fraction of Cnidoscolus aconitifolius leaves: coumaric acid (peak 1), amentoflavone (peak 2), hesperidin (peak 3), protocatechuic acid (peak 4), kaempferol (peak 5), dihydromyricetin (peak 6), quercitrin (peak 7), and rutin (peak 8).
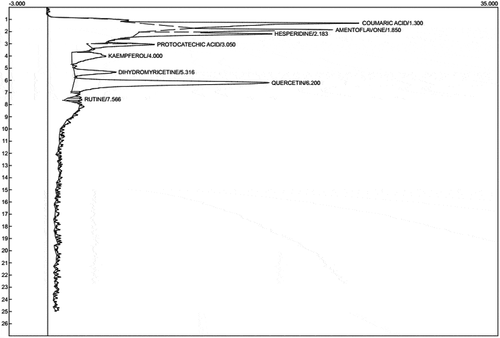
Figure 2. Metal ion chelating radical scavenging ability of ethyl acetate fraction of Cnidoscolus aconitifolius leaves. Values are represented as mean ± standard error of the mean (SEM) of triplicate experiment.
Legend: EAFCA: ethyl acetate fraction of Cnidoscolus aconitifolius leaves; EDTA: ethylenediaminetetraaceticacid.
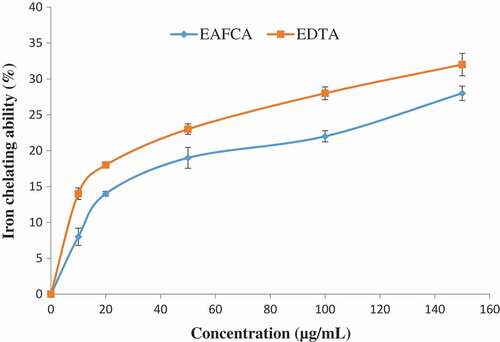
Figure 3. 2,2-Azino-bis3-ethylbenthiazoline-6-sulphonic acid (ABTS) radical scavenging ability of ethyl acetate fraction of Cnidoscolus aconitifolius leaves. Values are represented as mean ± standard error of the mean (SEM) of triplicate experiment.
Legend: EAFCA: ethyl acetate fraction of Cnidoscolus aconitifolius leaves.
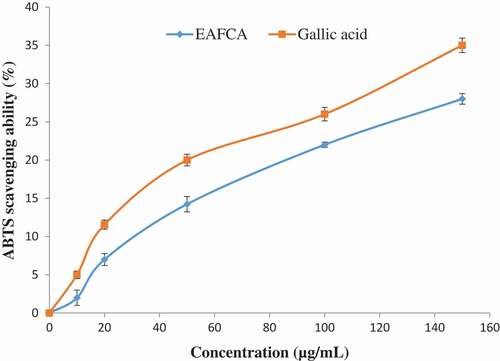
Figure 4. α-Amylase inhibitory potential of ethyl acetate fraction of Cnidoscolus aconitifolius leaves. Values are represented as mean ± standard error of the mean (SEM) of triplicate experiment.
Legend: EAFCA: ethyl acetate fraction of Cnidoscolus aconitifolius leaves.
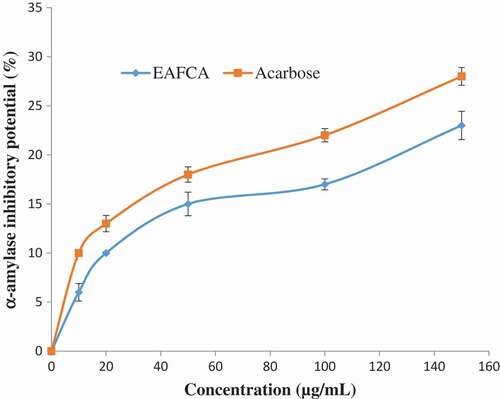
Figure 5. α-Glucosidase inhibitory potential of ethyl acetate fraction of Cnidoscolus aconitifolius leaves. Values are represented as mean ± standard error of the mean (SEM) of triplicate experiment.
Legend: EAFCA: ethyl acetate fraction of Cnidoscolus aconitifolius leaves.
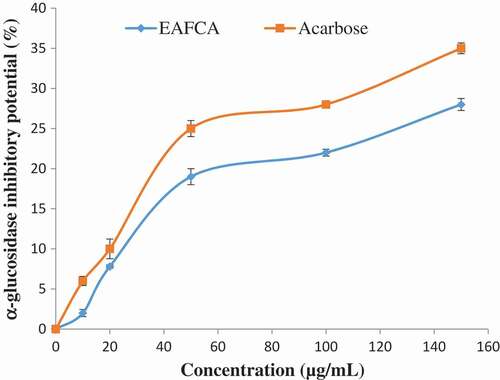
Figure 6. Acetylcholinesterase (AChE) inhibitory potential of ethyl acetate fraction of Cnidoscolus aconitifolius leaves. Values are represented as mean ± standard error of the mean (SEM) of triplicate experiment.
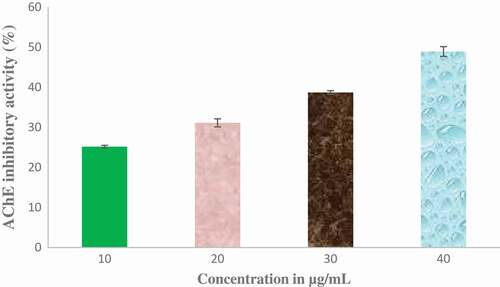
Figure 7. Butyrylcholinesterase (BChE) inhibitory potential of ethyl acetate fraction of Cnidoscolus aconitifolius leaves. Values are represented as mean ± standard error of the mean (SEM) of triplicate experiment.
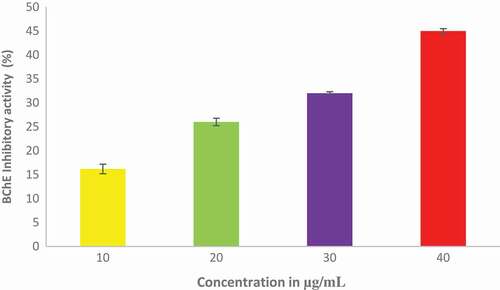
Figure 8. Inhibitory effect of ethyl acetate fraction of Cnidoscolus aconitifolius leaves on monoamine oxidase (MAO) activity. Values are represented as mean ± standard error of the mean (SEM) of triplicate experiment.
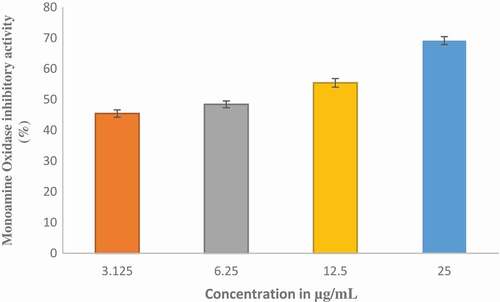
Figure 9. Inhibitory effect of ethyl acetate fraction of Cnidoscolus aconitifolius leaves on tyrosinase activity. Values are represented as mean ± standard error of the mean (SEM) of triplicate experiment.
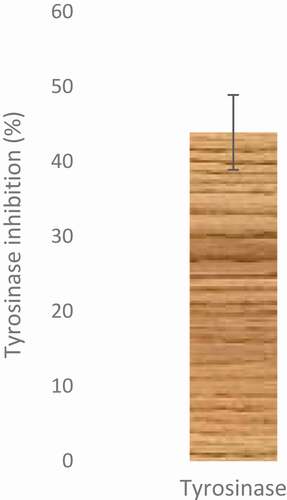
Figure 10. Inhibitory effect of ethyl acetate fraction of Cnidoscolus aconitifolius leaves on arginase activity. Values are represented as mean ± standard error of the mean (SEM) of triplicate experiment.
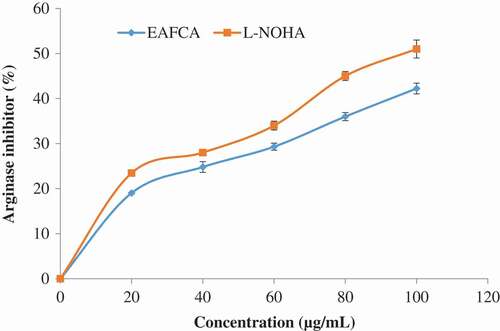
Figure 11. Inhibitory effect of ethyl acetate fraction of Cnidoscolus aconitifolius leaves on Na+/K+-ATPase activity. Values are represented as mean ± standard error of the mean (SEM) of triplicate experiment.
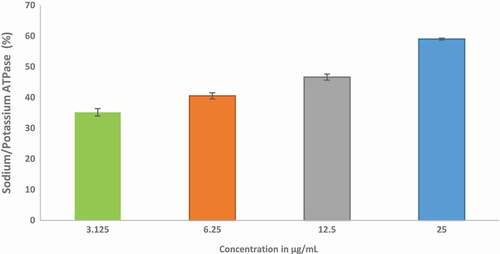
Figure 12. Inhibitory effect of ethyl acetate fraction of Cnidoscolus aconitifolius leaves on Ecto-5- nucleotidase activity. Values are represented as mean ± standard error of the mean (SEM) of triplicate experiment.
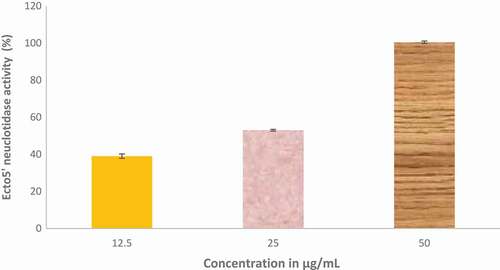
Figure 13. Inhibitory effect of ethyl acetate fraction of Cnidoscolus aconitifolius leaves on PDE-5 activity. Values are represented as mean ± standard error of the mean (SEM) of triplicate experiment.
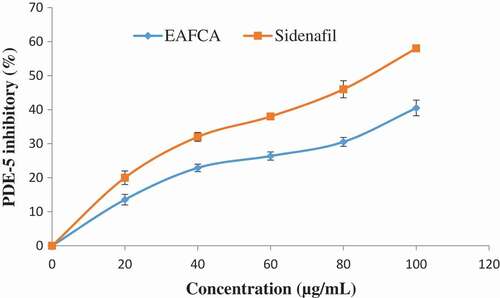
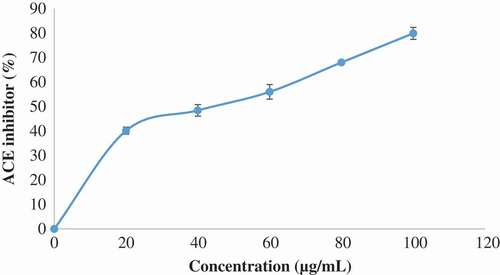
Figure 14. Inhibitory effect of ethyl acetate fraction of Cnidoscolus aconitifolius leaves on ACE activity. Values are represented as mean ± standard error of the mean (SEM) of triplicate experiment.