
Figures & data
Figure 1. Effects of in-vitro protein oxidization on carbonyl content of heat-induced protein gels during 28 days refrigeration. Note: Control, without oxidative treated samples; Oxidized, pre-oxidative treated samples. Different letters (a, b) are significantly different (P < 0.05) for the same treatment group among difference time, different letters (A, B) are significantly different (P < 0.05) for the same time; Values were presented as means ± standard deviation (n = 3).
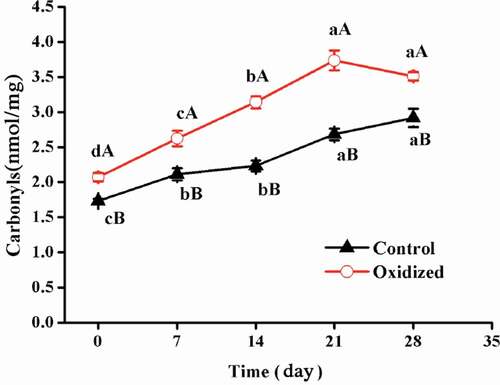
Figure 2. Effects of in-vitro protein oxidization on gel hardness (A) and WHC (B) of heat-induced gel during 28 days refrigeration. Note: Control, without oxidative treated samples; Oxidized, pre-oxidative treated samples. Different letters (a, b) are significantly different (P < 0.05) for the same treatment group among difference time, different letters (A, B) are significantly different (P < 0.05) for the same time; Values were presented as means ± standard deviation (n = 3).
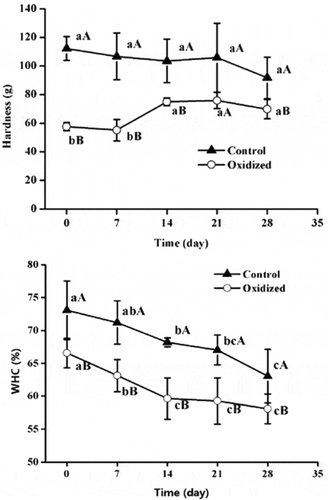
Figure 3. SEM microstructure of heat-induced protein gel subjected to in-vitro protein oxidation during 28 days refrigeration. Note: 0–4 were 0, 7, 14, 21 and 28 days, respectively. C was the scanning electron micrograph of Control samples, T was the scanning electron micrograph of oxidization samples.
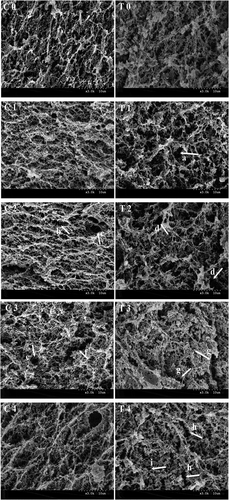
Figure 4. Effects of in-vitro protein oxidization on water distribution of chicken myofibrillar protein heat-induced gel (A: relaxation time; B: proportion of T22, C: proportion of T23) during 28 days refrigeration. Note: Control, without oxidative treated samples; Oxidized, pre-oxidative treated samples, Values were presented as means ± standard deviation (n = 3).
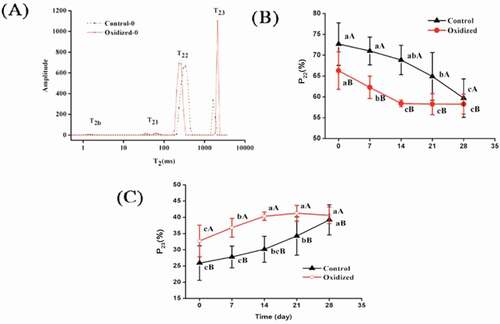
Table 1. Effect of protein oxidization on stability of heat-induced gel water distribution T2.
Table 2. Correlation among variables in study of the effect of protein oxidization on heat-induced gel storage stability.