Figures & data
Figure 1. External fluorescence spectrum of SPI, SPI-Md, and hydrolysates of SPI-Md conjugates.
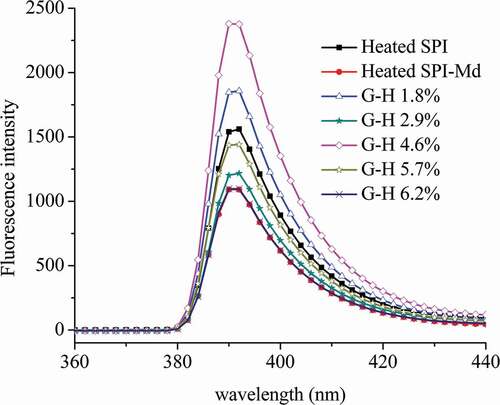
Figure 2. FT-IR spectrum of SPI, Md, SPI/Md mixture, SPI-Md conjugates, and hydrolysates of SPI-Md conjugates (DH 2.9%).
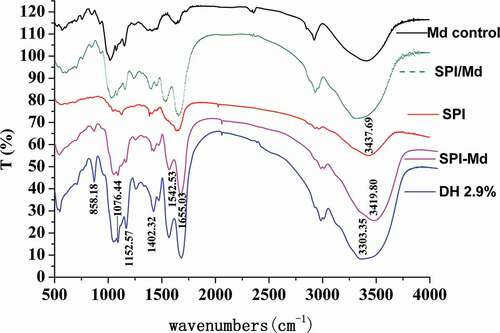
Table 1. Changes in free amino acid content (mg/100 ml) of SPI, SPI-Md, and hydrolysates of SPI-Md conjugates.
Table 2. Correlation coefficient of DH and antioxidant activity.
Figure 3. DPPH radical scavenging capacity of SPI, SPI-Md, and hydrolysates of SPI-Md conjugates at pH = 7.0.
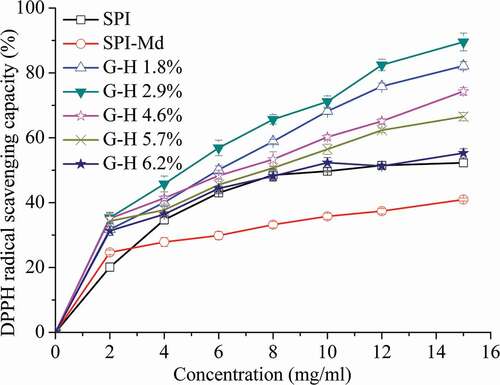
Figure 4. Fe2+ chelation activity of SPI, SPI-Md, and hydrolysates of SPI-Md conjugates at pH = 7.0.
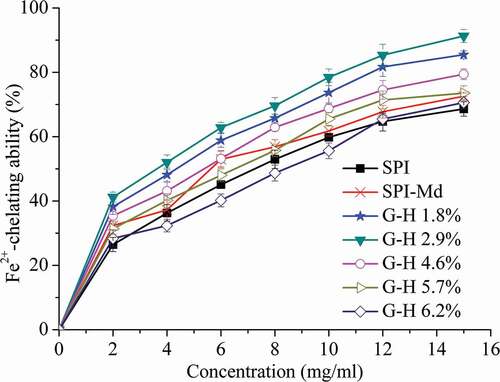
Figure 5. Reducing power of SPI, SPI-Md, and hydrolysates of SPI-Md conjugates at pH = 7.0.
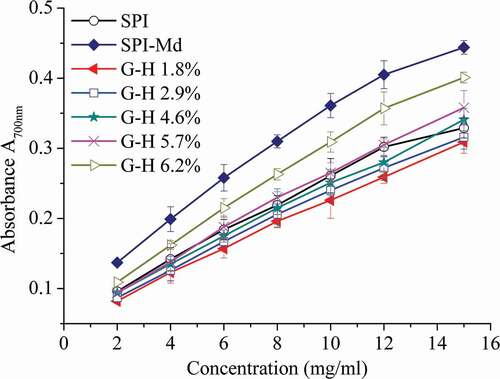
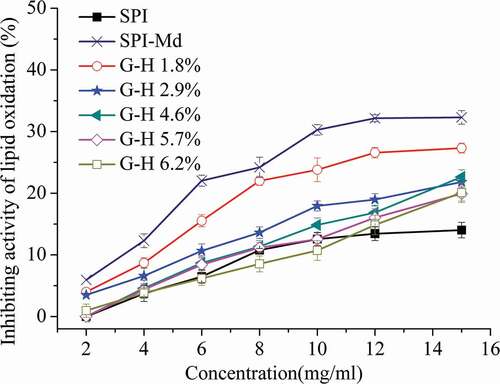
Figure 6. Lipid oxidation resistance of SPI, SPI-Md, and hydrolysates of SPI-Md conjugates at pH = 7.0.