Figures & data
Table 1. Lag time, level of increase, and critical moisture content (Xc) in the moisture content of soursop powder stored at RT and ET at the end of storage.
Figure 1. (A) Moisture content, (B) water activity, (C) glass transition temperature and (D) total color difference of soursop fruit powder stored at RT over 91 days.
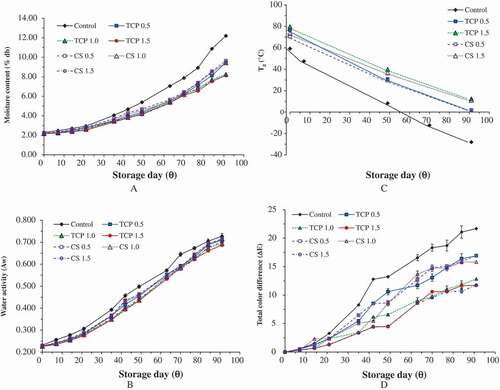
Figure 2. (A) Moisture content, (B) water activity, (C) glass transition temperature and (D) total color difference of soursop fruit powder stored at ET over 91 days.
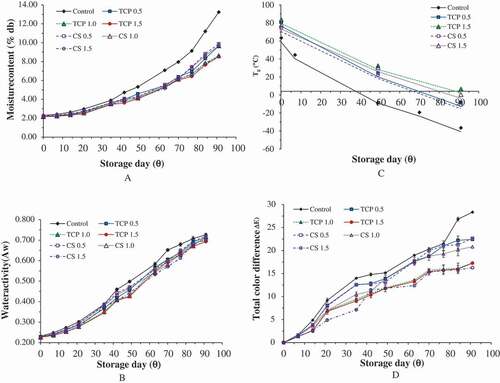
Figure 3. Color of spray-dried soursop powder from different treatments over storage period (A) control, (B) treated with 1.0% CS, (C) treated with 1.0% TCP and (D) control stored at RT and ET on Day 91.
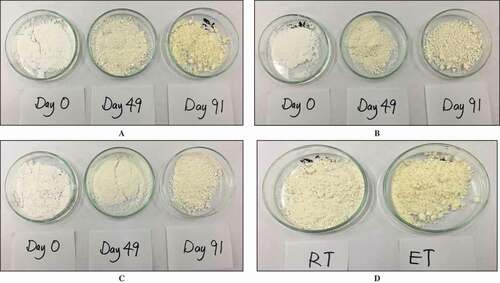
Figure 4. Color value (L*, a*, and b*) of spray-dried soursop powder from different treatments from storage Day 0 until Day 91 for storage at room temperature (RT) and elevated temperature (ET).
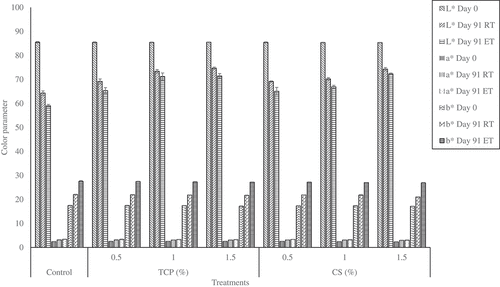
Table 2. Kinetic parameters and activation energy of soursop powder stored at RT and ET by fitting into degradation equation.
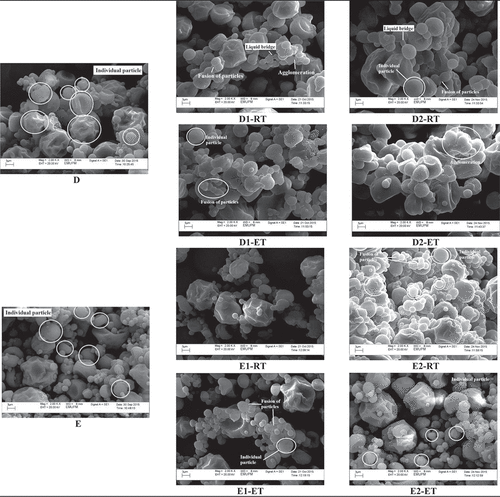
Figure 5a. Scanning electron micrographs of soursop powder obtained from different treatments (A) control, (B) treated with 0.5% TCP, (C) treated with 1.5% TCP, (D) treated with 0.5% CS, and (E) treated with 1.5% CS stored at RT and ET on (A-E) Day 0, (1) 49, and (2) 91 at magnification level of 2000×.
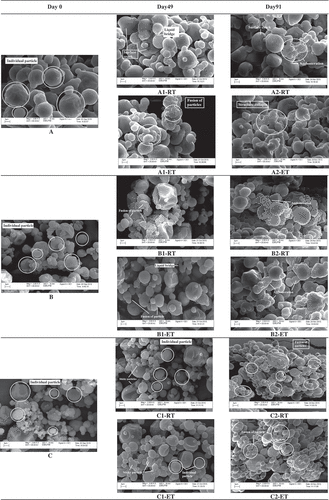
Figure 5b. Continued.