
Figures & data
Figure 1. Preparation technology of microencapsulated OPO.
Table 1. Experimental groups of mice.
Table 2. Fatty acid composition of OPO and human milk fat (%).
Table 3. Sensory evaluation of milk powder with different fats at 60°C for 30day storage (mean ± SD).
Table 4. Feed intake/body weight gain of mice (g/g).
Figure 2. Dietary intake and weight gain.
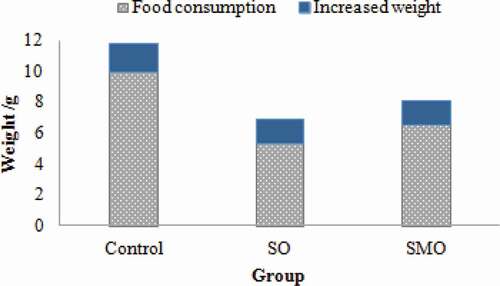
Table 5. Fatty acid composition of blood serum lipids (%).
Table 6. Fatty acid composition of faecal fats (%).
Table 7. The content of the calcium and magnesium in the mice faeces (%).
Table 8. Fatty acid composition of the intestinal absorption test (%).