
Figures & data
Figure 1. Effect of freeze–thaw cycles on water holding capacity in hairtail (Trichiurus haumela) samples frozen at −3℃ (◇), −18℃ (■), −40℃ (▲), and −80℃ (○). The error bars indicate the standard deviation obtained from a total of three analysis.
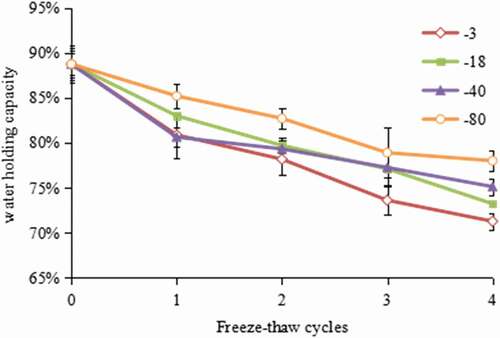
Figure 2. Effect of freeze–thaw cycles on TVBN value in hairtail (Trichiurus haumela) samples frozen at −3℃ (◇), −18℃ (■), −40℃ (▲). and −80℃ (○). The error bars indicate the standard deviation obtained from a total of three analysis.
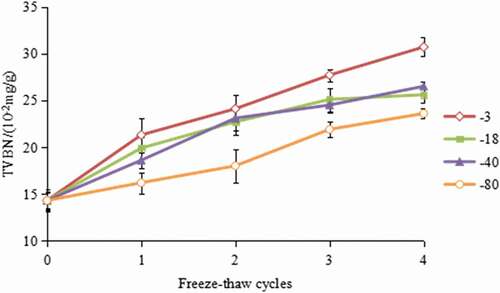
Figure 3. Effect of freeze–thaw cycles on TBARS value in hairtail (Trichiurus haumela) samples frozen at −3℃ (◇), −18℃ (■), −40℃ (▲), and −80℃ (○). The error bars indicate the standard deviation obtained from a total of three analysis.
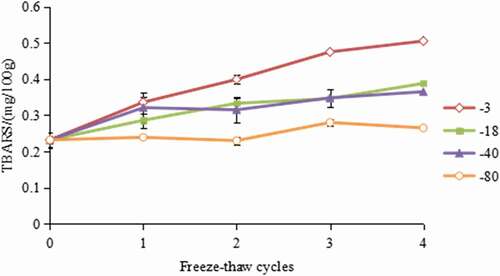
Figure 4. Effect of freeze–thaw cycles on total plate count in hairtail (Trichiurus haumela) samples frozen at −3℃ (◇), −18℃ (■), −40℃ (▲), and −80℃ (○). The error bars indicate the standard deviation obtained from a total of three analysis.
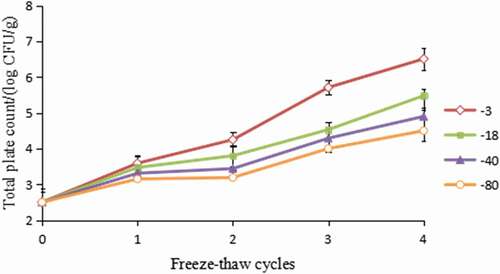
Figure 5. Effect of freeze–thaw cycles on the microstructure in hairtail (Trichiurus haumela) samples frozen at −3℃, −18℃, −40℃, and −80℃. (1, 2, 3, and 4 represent different numbers of freeze–thaw cycles).
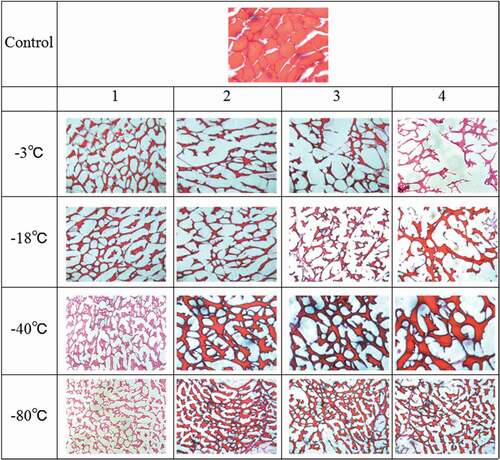
Figure 6. Effect of freeze–thaw cycles on fractal dimension value in hairtail (Trichiurus haumela) samples frozen at −3℃ (◇), −18℃ (■), −40℃ (▲) and −80℃ (○). The error bars indicate the standard deviation obtained from a total of three analysis.
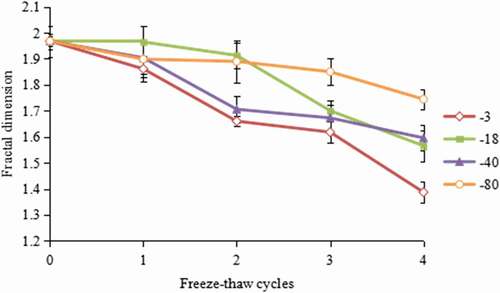
Table 1. Pearson correlation coefficients of fractal dimension in relation to water holding capacity, TVBN, TBARS, and total plate count.