Figures & data
Table 1. Comparison of fatty acid compositions between fresh palm olein (FPO), recycled cooking oil (RCO), and Codex standard (as a percentage of total fatty acids).
Figure 1. The gas chromatograms of the fatty acid composition analyses of (a) fresh palm oil, (b) recycled cooking oil, and (c) adulterated oil.
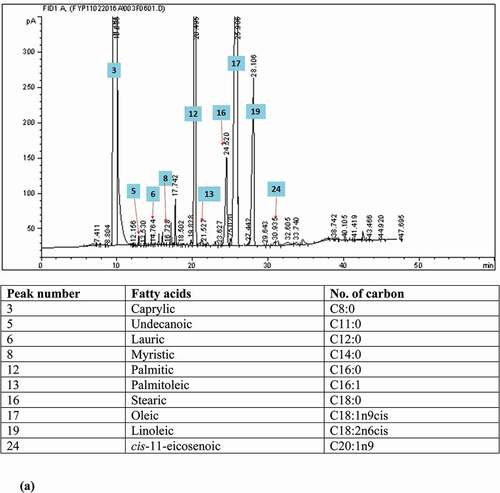
(continue).
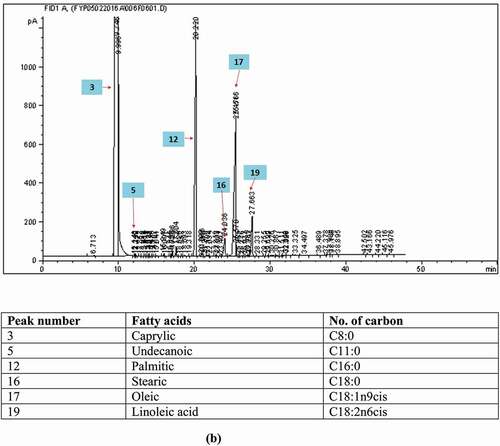
(continue).
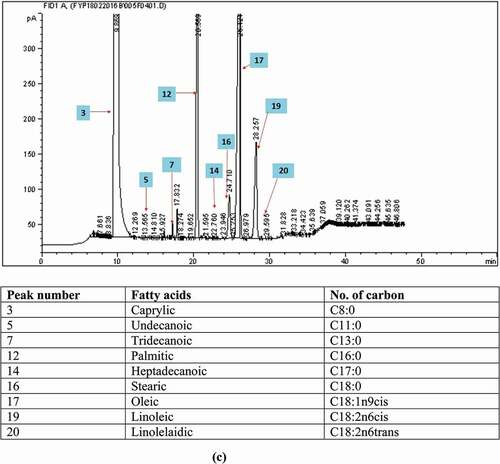
Table 2. Comparison of fatty acid compositions between fresh palm olein, recycled cooking oil, and adulterated oil samples with different adulteration levels (expressed as percentage of total fatty acids).
Figure 2. Magnitude of change in fatty acid compositions versus interval of adulteration level.
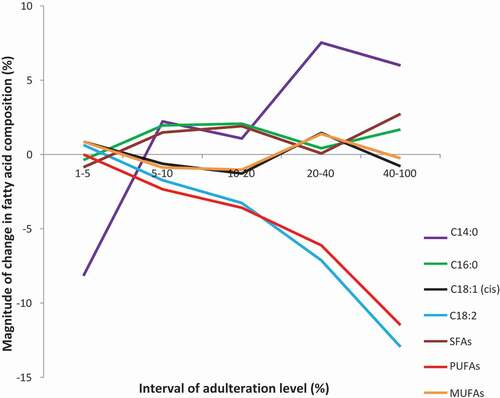
Figure 3. Comparison of the FTIR spectra between fresh palm olein (FPO) with refined palm olein (RPO), corn oil (CO), extra virgin olive oil (EVO), and sunflower oil (SFO) at 4000–650 cm−1.
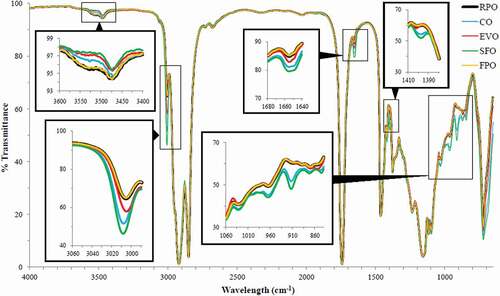
Table 3. Functional group assignment responsible for the specific characteristic band.
Figure 4. Comparison of the FTIR spectra of fresh palm olein (FPO) and recycled cooking oil (RCO) at 4000–650 cm−1.
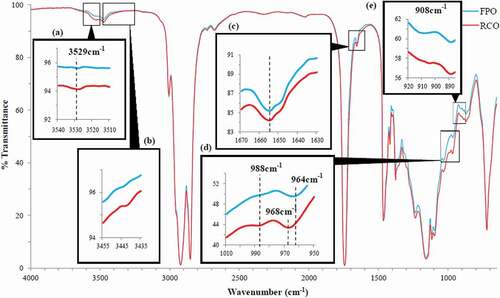
Figure 5. The FTIR spectral regions where variations between fresh palm olein (FPO) and recycled cooking oil (RCO) were significant (p < 0.05).
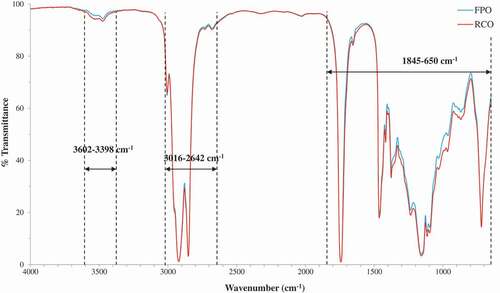
Table 4. The performances of the PLS calibration models for quantification of adulteration level in adulterated oil samples.
Figure 6. The optimized PLS calibration model for the relationship between actual versus FTIR-predicted adulteration level using FTIR normal spectral at the combined spectral region of 3602–3398 cm−1, 3016–2642 cm−1, and 1845–650 cm−1 for (a) calibration set (CA) and (b) validation set (VA).
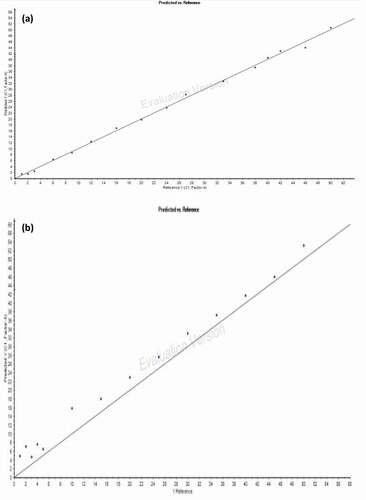
Figure 7. DA score plot for (a) the classification between fresh palm olein and adulterated oil samples together with (b) the classification of different packet oils into the group of fresh palm olein.
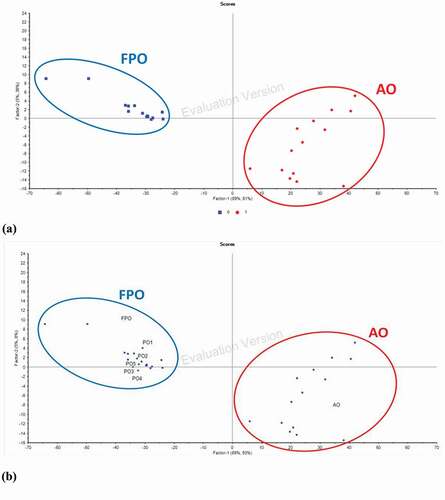
Table 5. FTIR-predicted adulteration level and fatty acid compositions of different packet oils.
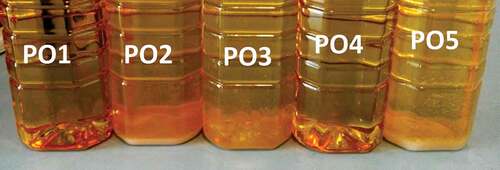
Figure 8. Visual observation of the packet oils purchased from the local market after 3 months of storage at a cool and dark place. The white box indicates precipitation happened in these oil samples after 3 months of storage.