Figures & data
Table 1. Physicochemical and in vitro digestion properties of low glycemic index (GI) rice flour.
Table 2. Apparent amylose, amylopectin, glycemic load, sweetness index, total sweetness index and sugar profile of low glycemic index (GI) rice flour.
Figure 1. Thermal decomposition behavior of low glycemic index (GI) rice flour (A): Thermal gravimetric analysis (TGA) of untreated and low glycemic index (GI) rice flour (B): Differential thermal gravimetric (DTG) of untreated and low glycemic index (GI) rice flour.
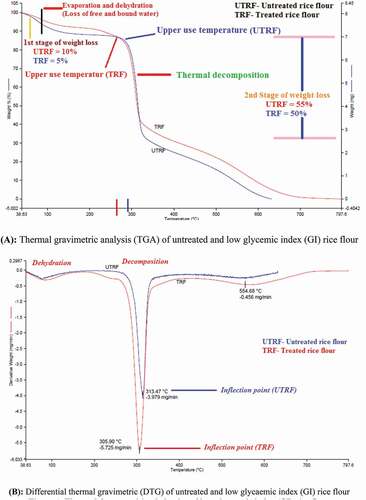
Figure 2. Particle size distribution of untreated and low glycemic index (GI) rice flour.
D[2,3] = surface area mean (Sauter Mean Diameter)D[3,4] = volume moment mean (De Brouckere Mean Diamater) – particles constituting the bulk of the sample volumeDv (90) = the diameter where 90% of the population lies below this value and 10% above thisDv (50) = the diameter where 50% of the population lies below this value and 50% above thisDv (10) = the diameter where 10% of the population lies below this value and 90% above this.
![Figure 2. Particle size distribution of untreated and low glycemic index (GI) rice flour.D[2,3] = surface area mean (Sauter Mean Diameter)D[3,4] = volume moment mean (De Brouckere Mean Diamater) – particles constituting the bulk of the sample volumeDv (90) = the diameter where 90% of the population lies below this value and 10% above thisDv (50) = the diameter where 50% of the population lies below this value and 50% above thisDv (10) = the diameter where 10% of the population lies below this value and 90% above this.](/cms/asset/05a5d9dd-43cf-4e43-9bf3-59ba562f1b60/ljfp_a_1545789_f0002_oc.jpg)
Figure 3. Scanning electron micrographs of low glycemic index rice flour.
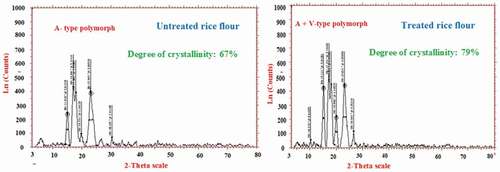
Figure 4. X-ray diffractrometry of low glycemic index rice flour showing ln(counts) at each Bragg’s angle (2θ).