Figures & data
Figure 1. AFM images of the longissimus lumborum (LL) muscle fibers. (a) Optical microscopy field of view. (b) Typical AFM 2D image of muscle fiber which drawn with section analysis line. (c) Section analysis profile curve of AFM 2D height image of muscle fiber.
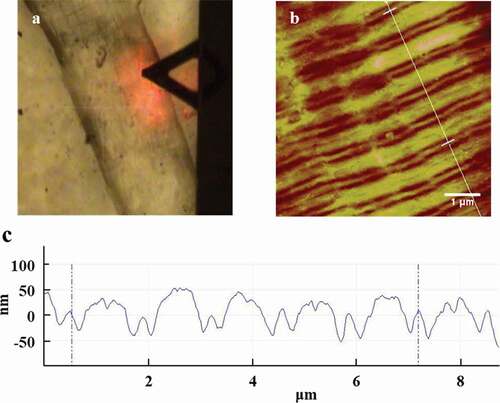
Figure 2. AFM 2D images of the longissimus lumborum (LL) muscle fibers. (a) and (b) Control at 5 min. (c) and (d) Treated with 100 W ultrasound bath for 5 min.
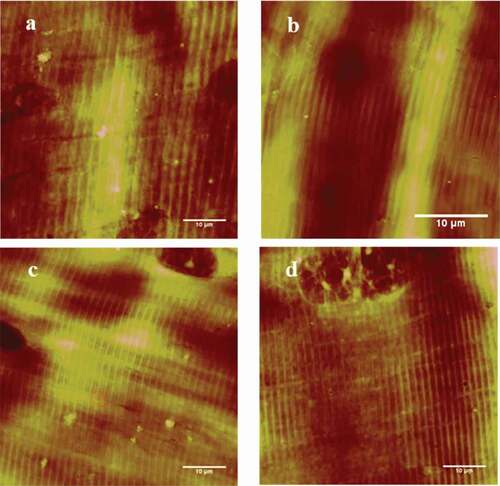
Figure 3. Changes of sarcomere length of the longissimus lumborum (LL) muscle fibers treated with the ultrasound bath. Values with different letters are significantly different among the intensities (P < 0.05).
Figure 4. AFM height images of the longissimus lumborum (LL) muscle fibers. (a) and (b) Control with deionized water at 24 h. (c) and (d) Treated with 500 mM CaCl2 for 24 h.
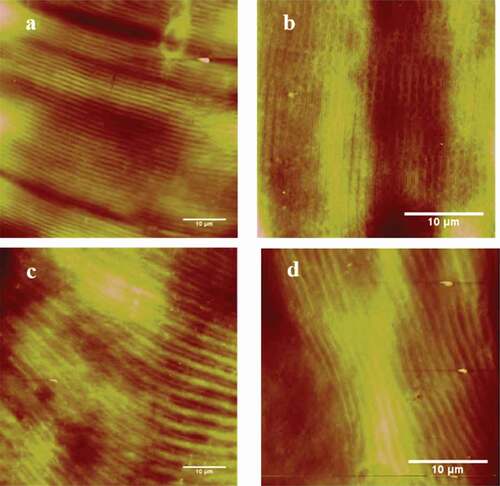
Figure 5. Changes of sarcomere length of the longissimus lumborum (LL) muscle fibers treated with CaCl2. Values with different letters are significantly different among the concentrations (P < 0.05).
Figure 6. AFM height images of the longissimus lumborum (LL) muscle fibers. (a) and (b) Control with deionized water at 24 h. (c) and (d) Treated with 300 mM NaCl for 24 h.
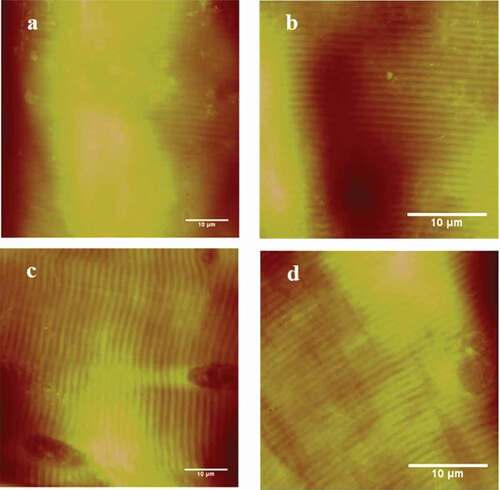
Figure 7. Changes of sarcomere length of the longissimus lumborum (LL) muscle fibers treated with NaCl. Values with different letters are significantly different among the concentrations (P < 0.05).
Figure 8. Comparison of effects of ultrasound with the intensity of 100 W, 500 mM CaCl2, and 300 mM NaCl injection on the muscle fibers from Qichuan beef. Values with different letters are significantly different among three methods (P < 0.05). Error bars, mean ± SE.