Figures & data
Figure 1. Changes of morphology and texture in SJBW during low-temperature treatment at 37°C. (a) The morphological observation; (b) soluble collagen of SJBW at 37°C for different time analyzed. Control was the fresh sample. The result is representative of three independent experiments; (c) changes in the hardness of SJBW at 37°C for different time; (d) changes in the chewiness of SJBW at 37°C for different time periods. Different letters indicate significant differences (p < 0.05).
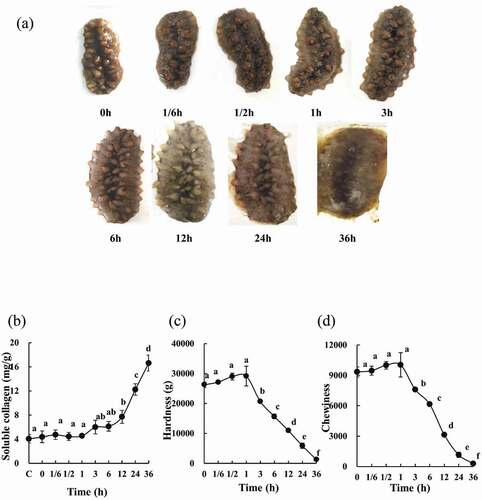
Figure 2. Protein degradation and change in CL activity in SJBW during low-temperature treatment at 37°C. (a) SDS–PAGE photographs of protein degradation. Ten micrograms of each sample were loaded in 10% (w/v) SDS–PAGE gel. HM, high MARK; LM, low MARK; (b) CL activity measured by a fluorospectrophotometer. Data are reported as mean ± SD based on three replicates. Different letters indicate significant differences (p < 0.05). (c) Control was the fresh sample.
Figure 3. DNA fragmentation and caspase-3 activation in SJBW during low-temperature treatment at 37°C. (a) DNA fragmentation analyzed by agarose electrophoresis. The result is representative of three independent experiments; (b) caspase-3 activity was measured by using a spectrophotometer. The values represent means ± SD of three separate experiments. Different letters indicate significant differences (p < 0.05). Control was the fresh sample.
Figure 4. MAPK phosphorylation in SJBW during low-temperature treatment at 37°C. Twenty micrograms of protein was loaded per lane. Control was the fresh sample. Samples were analyzed with western blotting to determine the phosphorylation of p38, JNK, and ERK. β-actin was used as a loading control. Results are representative of three independent experiments.
Figure 5. ROS production in SJBW during low-temperature treatment at 37°C. (a) ESR spectra of lyophilized SJBW at 37°C for different time induced free radical production; (b) free radical level of lyophilized SJBW at 37°C. Different letters indicate significant differences (p < 0.05).
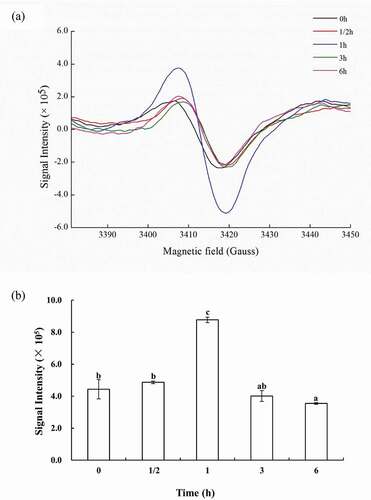
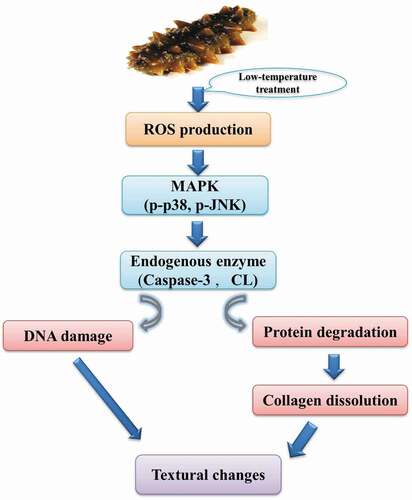
Figure 6. Schematic diagram for a proposed signal cascades in SJBW during low-temperature treatment at 37°C.