Figures & data
Table 1. Composition of digestive juices (500 mL) used for in vitro incubation of protein sample.
Figure 1. In vitro digestive model.
Figure 2. Viscosity (η) (a) and shear stress (b) of different protein concentrations (3 g/100 g (raw materials/H2O)–9 g/100 g (raw materials/H2O)) at 25°C.
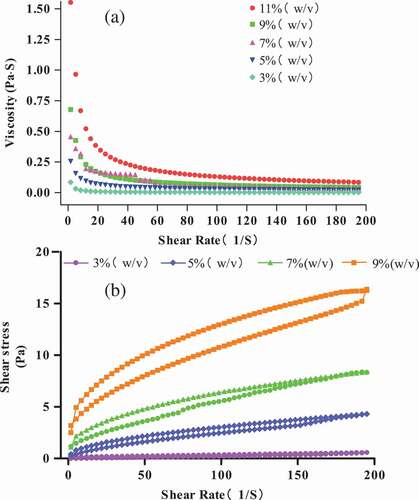
Figure 3. Viscosity (η) (a) and shear stress (b) of 3 g/100 g (raw materials/H2O) protein solution at different temperatures (25°C, 35°C, and 45°C).
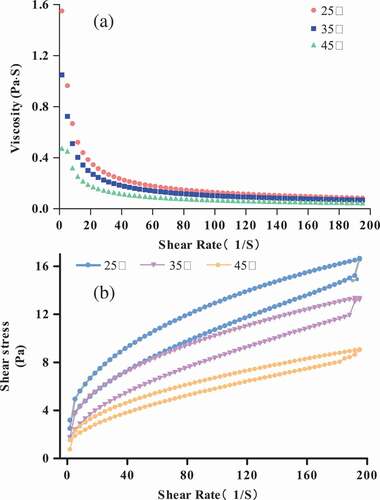
Figure 4. Modulus of 15 g/100 g (raw materials/H2O) protein solution at different pH at 70°C. (a) Modulus of 15 g/100 g (raw materials/H2O) protein solution at pH 2.0. (b) Modulus of 15 g/100 g (raw materials/H2O) protein solution at pH 5.0.
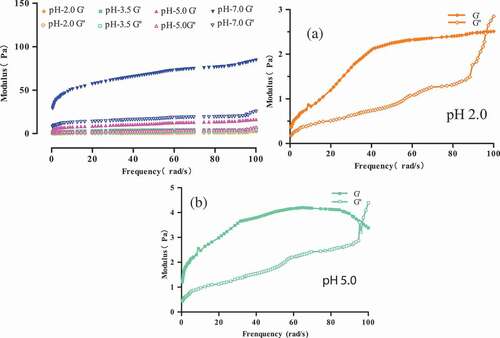
Table 2. Effect of pH on the sulfhydryl and disulfide bond contents.
Table 3. Connection between physicochemical and rheological properties.
Table 4. The Power Law model of protein in different conditions.
Figure 5. Evolution of storage modulus (G’) and loss modulus (G’’) at 0.5 Hz for 15 g/100 g (raw materials/H2O) protein solution with different temperatures by adding different concentrations of Ca2+.
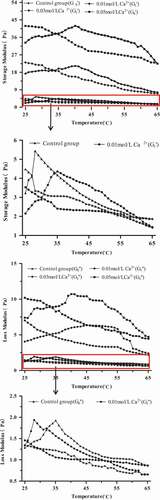
Figure 6. The surface hydrophobicity (H0) of Pleurotus eryngii protein.
Note: a is control standard; b and c mean significant difference (P < 0.05).
Table 5. The contents of sulfhydryl and disulfide bond of protein treated by heat and ultrasound.
Table 6. Secondary structure of the Pleurotus eryngii protein.
Figure 7. The FT-IR spectra of Pleurous eryngii protein in the region of 400~4000 cm–1.
Figure 8. The fitted peaks of Pleurous eryngii protein in the region of 1600~1700 cm–1.
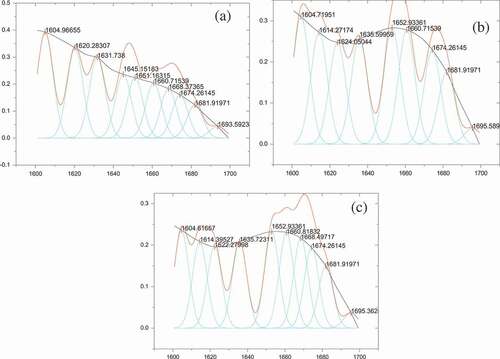
Table 7. The denaturation temperature (Tm) and enthalpy change (△H) of Pleurotus eryngii protein.
Figure 9. The DSC and TG results of Pleurous eryngii protein.
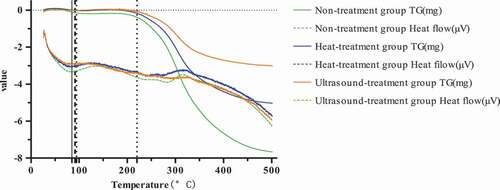
Figure 10. DH and VDP of Pleurous eryngii protein
Note: a is control standard, b and c means significant difference (P < 0.05).
Table 8. Amino acid composition of protein digestive juice.
Figure 11. The peptide content of protein digestive juice Note: a is control standard, b and c means significant difference (P < 0.05)
Figure 12. The absorption intrinsic of Pleurous eryngii protein and protein digestive products.
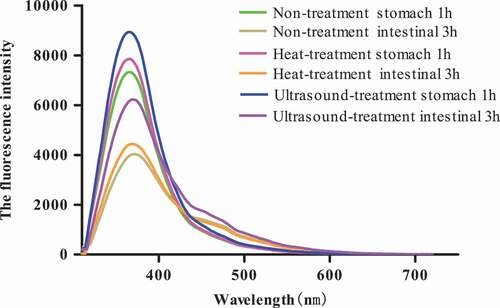
Figure 13. The antioxidant of protein digestive products.