Figures & data
Figure 1. Chromatographic elution profile of POD from plums: A. Separation on HiPrep Phenyl FF 16/10 (HIC); B. Separation on Mono Q 5/50 GL (IEC). The active fractions were monitored by UV absorbance at 280 nm, and the enzymatic activity was determined with a substrate solution with guaiacol and 3% hydrogen peroxide, at 470 nm.
![Figure 1. Chromatographic elution profile of POD from plums: A. Separation on HiPrep Phenyl FF 16/10 (HIC); B. Separation on Mono Q 5/50 GL (IEC). The active fractions were monitored by UV absorbance at 280 nm, and the enzymatic activity was determined with a substrate solution with guaiacol and 3% hydrogen peroxide, at 470 nm.](/cms/asset/b25ab4e3-8c32-4133-9a85-b2b575038b36/ljfp_a_1560311_f0001_oc.jpg)
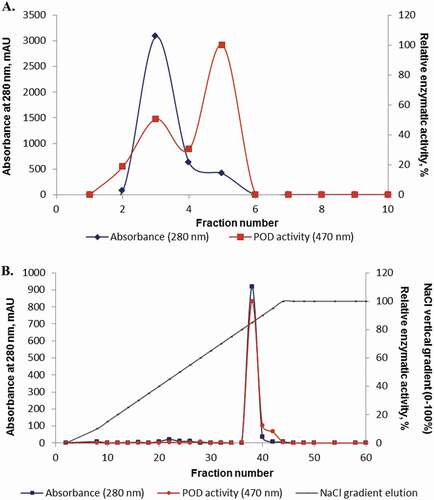
Table 1. Partial purification of POD from plums and protein content determined by Bradford method.
Figure 2. SDS-PAGE of POD from plums. Lane 1: Precision Plus Protein Dual Xtra molecular weight marker; Lane 2: HIC fractions; Lane 3: IEC fractions; Native PAGE of POD from plums. Lane 4: partially purified extract (30–90% ammonium sulfate).
![Figure 2. SDS-PAGE of POD from plums. Lane 1: Precision Plus Protein Dual Xtra molecular weight marker; Lane 2: HIC fractions; Lane 3: IEC fractions; Native PAGE of POD from plums. Lane 4: partially purified extract (30–90% ammonium sulfate).](/cms/asset/e13aaf26-7d72-4b9b-96c4-5a9ce0c9b7ea/ljfp_a_1560311_f0002_oc.jpg)
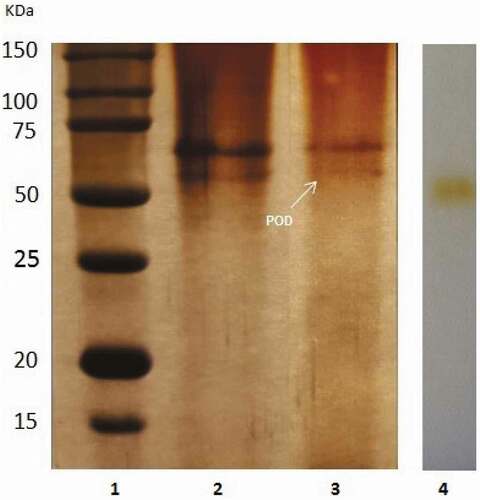
Table 2. Single molecule level details on the interaction between POD and different specific substrate molecules.
Table 3. Effects of various inhibitors on the activity of POD from plums.
Figure 3. The temperature effect on POD from plums: A. Thermal inactivation at different temperature values: 60°C (
![](/cms/asset/60d990c4-1072-4589-b6e1-9a41b10ebfcb/ljfp_a_1560311_ilg0002.jpg)
![](/cms/asset/7ed5db5d-eb2b-476d-8c33-62f7405813fe/ljfp_a_1560311_ilg0003.jpg)
![](/cms/asset/5d00a081-c636-4cf7-8337-9e9148cae4ce/ljfp_a_1560311_ilg0004.jpg)
![](/cms/asset/9dd1cb0a-b80a-4f2c-a2f4-86789f5d86f4/ljfp_a_1560311_ilg0005.jpg)
![](/cms/asset/9fc4e66c-debf-49a7-b8f1-2118d8c942bf/ljfp_a_1560311_ilg0006.jpg)
![Figure 3. The temperature effect on POD from plums: A. Thermal inactivation at different temperature values: 60°C (Display full size), 65°C (Display full size), 70°C (Display full size), 75°C (Display full size), 80°C (Display full size), and 85°C (Display full size) (A is the POD activity at time t, and A0 is the initial enzymatic activity).](/cms/asset/5d24dfcd-5fd7-4e75-992a-129df33239f3/ljfp_a_1560311_f0003_oc.jpg)
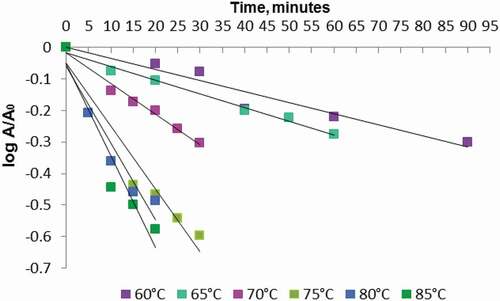
Table 4. Estimated kinetic parameters of POD from plums inactivation.
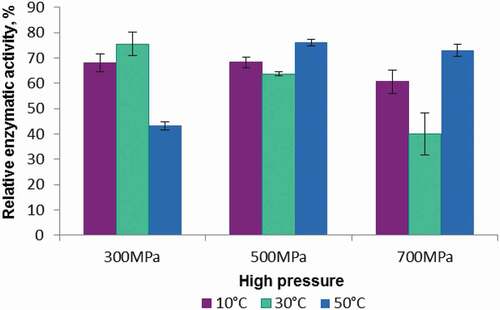