
Figures & data
Table 1. Single-segment substitution lines with different Wx alleles used in the present study.
Table 2. Amylopectin chain length distribution of rice starches from single-segment substitution lines with different Wx allelesa.
Figure 1. FACE chromatogram of amylopectin in endosperm from rice single-segment substitution lines with different Wx alleles. (a) Molar percentage distribution of isoamylase-debranched amylopectin and (b) chain length number distribution. All the chromatograms of branch chain length distribution of amylopectin were normalized in order to avoid the effect of different sample concentrations.
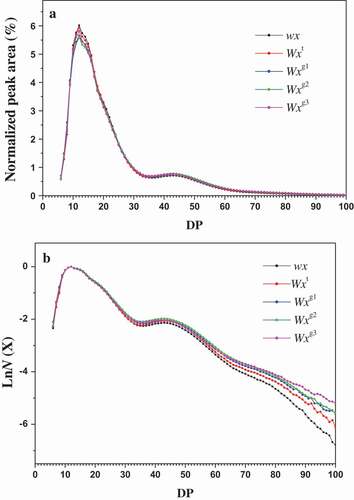
Table 3. Correlation coefficients between structural characteristics of starches from rice single-segment substitution lines with different Wx allelesa.
Figure 2. Hydrolysis properties of native starches from rice single-segment substitution lines with different Wx alleles. Vertical bars represent mean values ± standard deviations (n = 3). The hydrolysis degrees are expressed as the percentage of soluble carbohydrates released from native starches by PPA (a) and AAG (b).
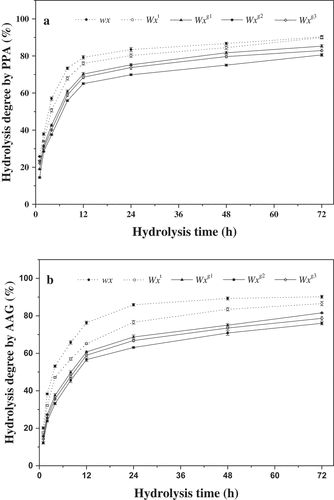
Figure 3. Digestion properties of native starches from rice single-segment substitution lines with different Wx alleles. Vertical bars represent mean values ± standard deviations (n = 3). The digestion degrees are expressed as the percentage of glucose released from native starches by PPA and AAG.
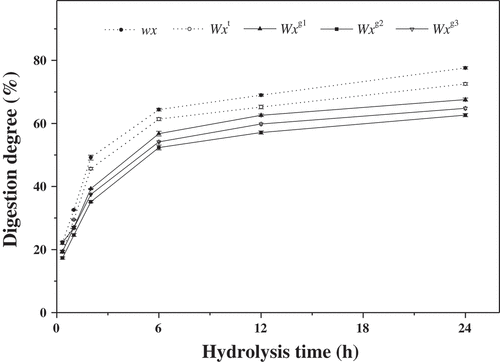
Table 4. In vitro digestion properties of native starches from rice single-segment substitution lines with different Wx allelesa.
Table 5. Correlation coefficients between molecular structure and enzyme hydrolysis of starches from rice single-segment substitution lines with different Wx allelesa.