Figures & data
Figure 1. Effect of different pretreatment on the color of Hypsizygus marmoreus. ** P < 0.01 indicates a statistical difference between control and treatment groups. ▽ P < 0.05 indicates a statistical difference between H and CHH groups. Values are mean ± SD. H group: heating group; CHH group: color protection, hardening, and heating group
Figure 2. Effect of different pretreatment on the texture of Hypsizygus marmoreus ** P < 0.01 indicates a statistical difference between control and treatment groups. ▽ P < 0.05 indicates a statistical difference between H and CHH groups. Values are mean ± SD. H group: heating group; CHH group: color protection, hardening, and heating group
Figure 3. Microstructure analysis of Hypsizygus marmoreus using scanning electron microscopy. A1, B1, and C1 are from control group; A2, B2, and C2 are from heating group; A3, B3, and C3 are from color protection, hardening, and heating group. A1, A2, and A3 × 100; B1, B2, and B3 × 300; C1, C2, and C3 × 1000
Figure 4. Effect of different pretreatment on brown-related enzyme activity of Hypsizygus marmoreus. ** P < 0.01 indicates a statistical difference between control and treatment groups. ▽ P < 0.05 indicates a statistical difference between H and CHH groups. Values are mean ± SD. H group: heating group; CHH group: color protection, hardening, and heating group
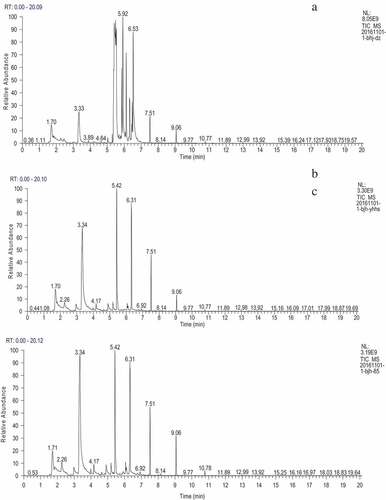
Table 1. The effect of different treatments on volatile components (H group: heating group; CHH group: color protection, hardening, and heating group)
Figure 5. Ion flow diagram of volatile components of Hypsizygus marmoreus in control group (a), heating group (b), and color protection, hardening, and heating group (c)