Figures & data
Figure 1. Typical AFM height images of myofibrillar proteins in different concentrations of NaCl at various pH values. a, b, c stand for myofibril proteins were treated by 0.1 M, 0.3 M, and 0.6 M NaCl, respectively, and 1 to 3 mean pH = 5.5, 6.5, 7.5
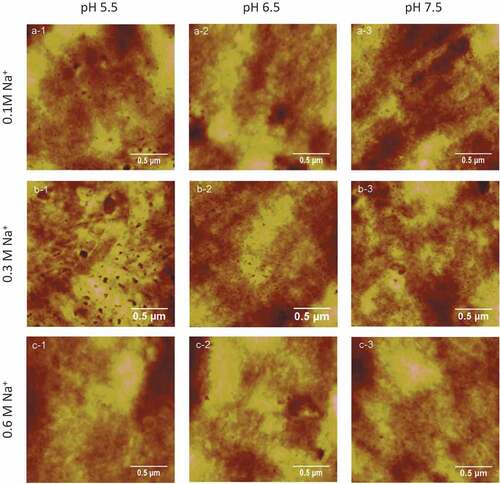
Figure 2. Roughness of myofibrillar proteins in different concentrations of NaCl at various pH values
The same salt concentration with different letters (a–c) are different (P < 0.05). The same pH with different letters (x–z) are different (P < 0.05).
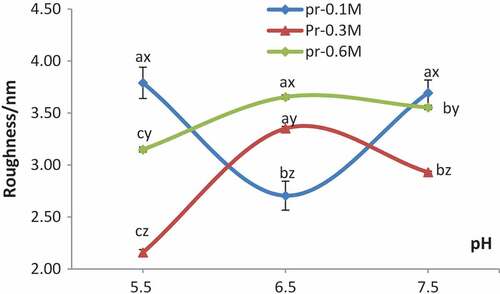
Figure 3. Typical AFM height images of gels in different concentrations of NaCl at various pH values
a, b, c stand for myofibril proteins treated by 0.1 M, 0.3 M and 0.6 M NaCl, respectively, and 1 to 3 mean pH = 5.5, 6.5, 7.5.
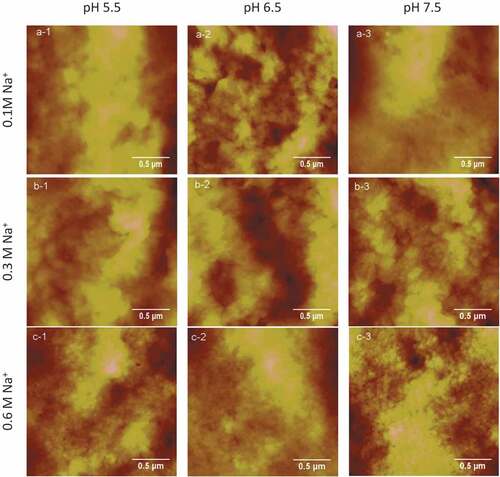
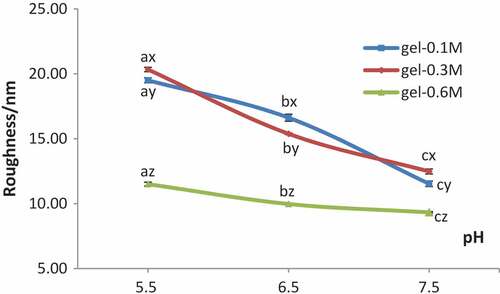
Figure 4. Roughness of gels in different concentrations of NaCl at various pH values
The same salt concentration with different letters (a–c) are different (P < 0.05). The same pH with different letters (x–z) are different (P < 0.05).