Figures & data
Figure 1. Changes in pH (a), ammonia nitrogen (b), TVBN (c), TMAN (d) and TCA-soluble peptides (e) content of skate muscle during fermentation. Bars represent standard deviation from three determinations. a–hMeans followed by different letters are significantly different (p < 0.05)
Table 1. Textural profiles analysis in skate muscle during fermentation
Figure 2. Fractions of each protein in skate muscle during fermentation
Figure 3. SDS-PAGE patterns of myofibrillar proteins (a), sarcoplasmic proteins (b), and alkali-soluble proteins (c) from skate muscle during fermentation
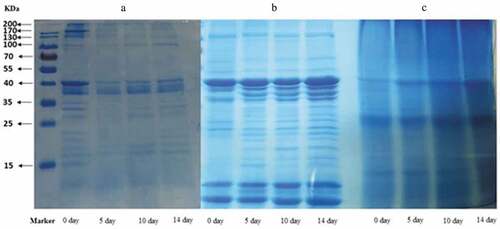
Table 2. Changes in free amino acid content of skate muscle during fermentation
Figure 4. Principal compound analysis of some parameters related to different protein fractions of skate muscle. MFN: Myofribrillar fraction nitrogen, SPN: Sarcoplasmic protein nitrogen, NPN: Non-protein nitrogen, ASN: Alkali-soluble protein nitrogen, TSP: TCA-soluble peptide