
Figures & data
Table 1. NSI and DH of different enzymes
Figure 1. Effect of single factor experiment on NSI of modified protein. When the reaction time was 40 min and the enzyme dosage was 0.3%, the reaction temperatures were selected to be 30°C, 40°C, 50°C, 60°C, and 70°C. When the reaction temperature was 40°C and the enzyme dosage was 0.3%, the reaction time was selected to be 0, 20, 40, 60, 80 and 100 min. When the reaction temperature was 40°C and the reaction time was 40 min, the enzyme dosage was 0.1%, 0.2%, 0.3%, 0.4%, and 0.5%. Three replicates were performed for each sample
Figure 2. Response surfaces and contour maps of complex proteases affecting NSI of the modified protein
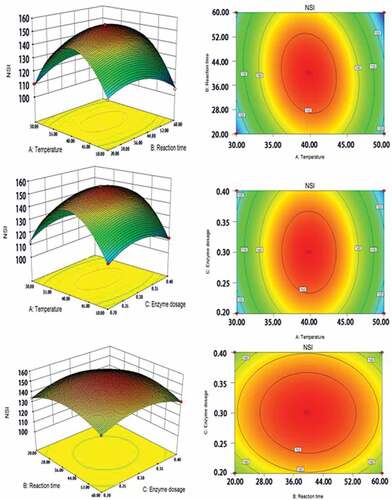
Figure 3. Fluorescence spectra of WG and CPMP
Table 2. Response surface test factor level for enzymatically modified treatment
Table 3. Response surface optimization test results for complex protease
Table 4. Regression model analysis of variance table
Figure 4. UV-visible spectroscopy of WG and CPMP
Figure 5. SEM of WG and CPMP (5000 X)
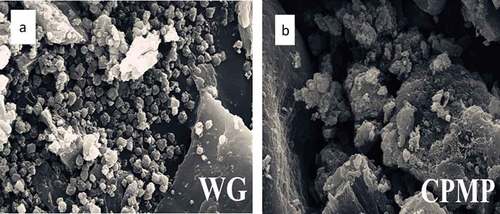
Table 5. Comparison of functional properties of WG before and after modification