
Figures & data
Table 1. Composition of control and probiotic Cheddar cheeses
Figure 1. WSE SDS-PAGE gel electrophoresis. Line 1: control; Line 2: cheese with Lactobacillus casei; Line 3: cheese with Lactobacillus plantarum; Line 4: cheese with Lactobacillus plantarum and Lactobacillus casei
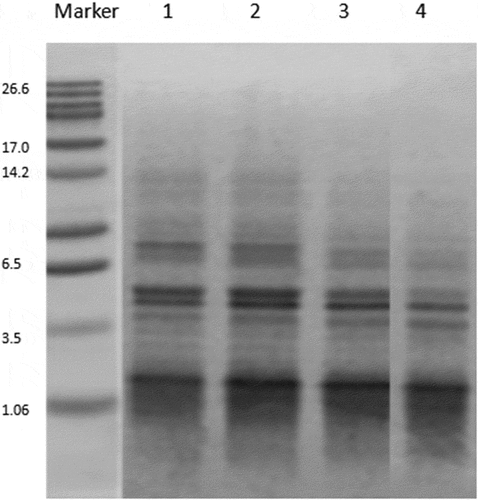
Figure 2. DPPH radical scavenging activity of WSE obtained from Cheddar cheese. Results are expressed as mean ± standard error of means; n = 3 sets of data analysed in duplicate. A-D Means in the same stages of ripening by different samples are significantly different (P<0.05).a-g Means in the same sample by different stages of ripening are significantly different (P < 0.05).Batch 1: control; Batch 2: Lactobacillus casei; Batch 3: Lactobacillus plantarum; Batch 4: Lactobacillus plantarum and Lactobacillus casei
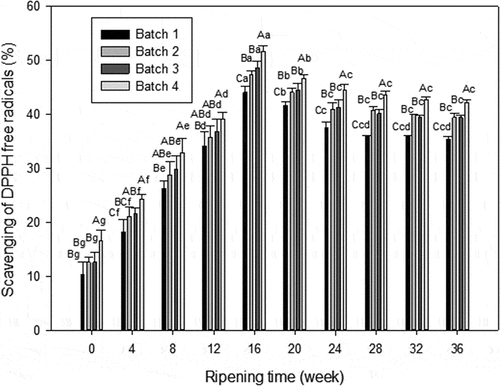
Figure 3. DPPH radical scavenging activity (IC50 value in mg/mL) of WSE obtained from Cheddar cheese. Results are expressed as mean ±standard error of means; n = 3 sets of data analysed in duplicate. Batch 1: control; Batch 2: Lactobacillus casei; Batch 3: Lactobacillus plantarum; Batch 4: Lactobacillus plantarum and Lactobacillus casei
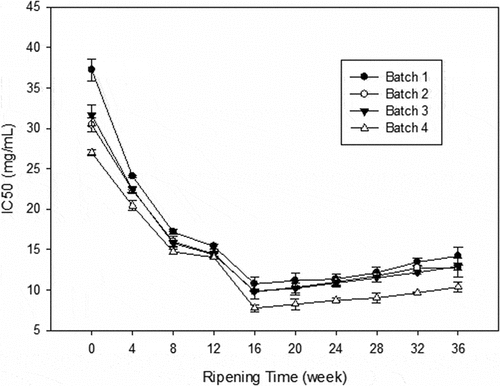
Figure 4. Reducing power of WSE obtained from Cheddar cheese. Results are expressed as mean ± standard error of means; n = 3 sets of data analysed in duplicate. A-D Means in the same stages of ripening by different samples are significantly different (P<0.05).a-g Means in the same sample by different stages of ripening are significantly different (P<0.05). Batch 1: control; Batch 2: Lactobacillus casei; Batch 3: Lactobacillus plantarum; Batch 4: Lactobacillus plantarum and Lactobacillus casei
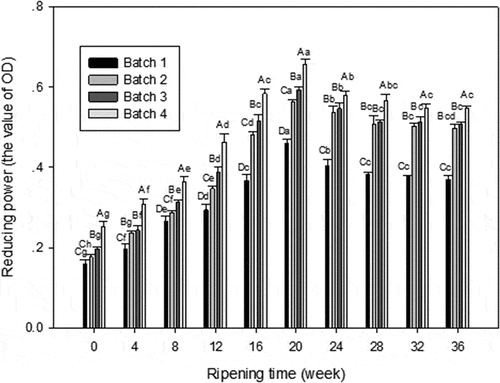
Figure 5. Hydroxyl radical scavenging activity of WSE obtained from Cheddar. Results are expressed as mean ± standard error of means; n = 3 sets of data analysed in duplicate. A-D Means in the same stages of ripening by different samples are significantly different (P<0.05).a-g Means in the same sample by different stages of ripening are significantly different (P<0.05). Batch 1: control; Batch 2: Lactobacillus casei; Batch 3: Lactobacillus plantarum; Batch 4: Lactobacillus plantarum and Lactobacillus casei
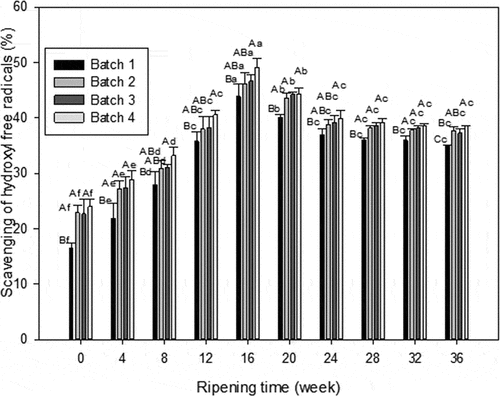
Figure 6. The DPPH radical scavenging activity of WSE before and after simulated gastrointestinal digestion. Results are expressed as mean ± standard error of means; n = 3 sets of data analyzed in duplicate. A-D Means in the same stages of digestion by different samples are significantly different (P < 0.05).a-g Means in the same sample by different stages of digestion are significantly different (P < 0.05). Batch 1: control; Batch 2: Lactobacillus casei; Batch 3: Lactobacillus plantarum; Batch 4: Lactobacillus plantarum and Lactobacillus casei
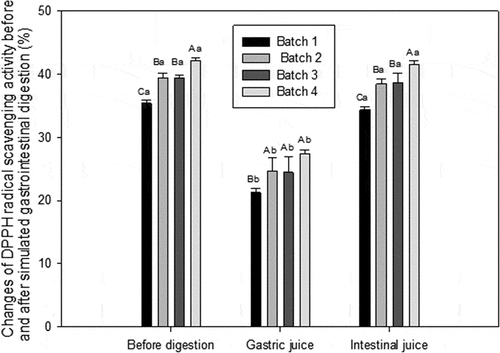
Table 2. Texture profile analysis (TPA) of control and probiotic Cheddar cheeses
Table 3. Sensory scores for control and probiotic Cheddar cheeses