Figures & data
Figure 1. Correlation of TPC and IC50 between two blocks. (a) Correlation of TPC between Block 1 and 2, (b) Correlation of IC50 between Block 1 and 2
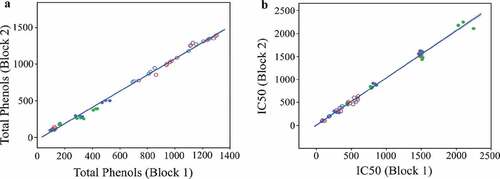
Figure 2. TPC, moisture content, height, and IC50 in seeds, sprouts, and grasses. (a) TPC, (b) moisture content, (c) height, and D: IC50. Each bar in the plot is an average of six samples collected from two blocks and three replicates in each block. The error bars indicate the standard deviation of the six samples. Different alphabets above the bars indicate a significant difference between the means (p < 0.05)
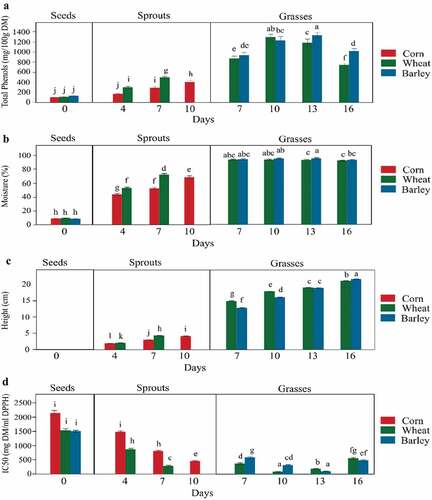
Figure 3. TPC and IC50 values in seeds, sprouts of corn and wheat, and grasses of wheat and barley. (a) TPC in sprouts, (b) TPC in grasses, (c) IC50 in sprouts, (d: IC50 in grasses. Each point in the plot is an average of six samples collected from two blocks and three replicates in each block. The error bars indicate the standard deviation of the six samples. Day 0 in each of the plots represents values for seeds
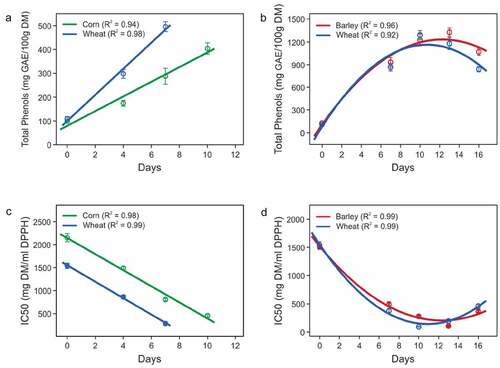
Table 1. TPC levels in sprouts and grass of various cereals. TPCs are expressed as mg GAE/100g DM
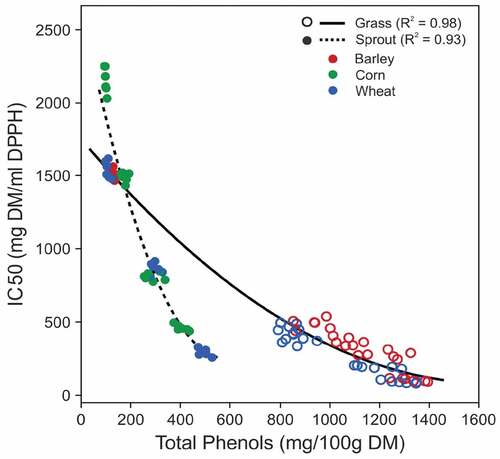
Figure 4. Correlation between TPC and IC50 values in sprouts of corn and wheat, and grasses of wheat and barley